
Visualizing and Analysing Biological Networks with STRING and Cytoscape
Slides:
https://cytoscape.github.io/cytoscape-tutorials/presentations/cytoscape-and-string-2018-cpr.html
John "Scooter" Morris
Lars Juhl Jensen
Novo Nordisk Foundation Center for Protein Research
University of Copenhagen
15 November 2018
Goals and Motivations
- Understand the major applications of network biology
- Import your data into Cytoscape
- Master network layouts and data visualization
- Know where to find relevant Cytoscape apps and tutorials
- Understand STRING and how to integrate STRING data into Cytoscape
Introductions
- Executive director, Resource for Biocomputing, Visualization, and Informatics
- Roving Engineer, National Resource for Network Biology
- Cytoscape team since 2006
- Author of over a dozen Cytoscape apps
Introductions
- Group leader, Cellular Network Biology @ CPR
- Member of the STRING team since 2003
- PI of the COMPARTMENTS, TISSUES, and DISEASES databases
- Developer of the underlying text-mining software
Introductions
- Clinicians
- Bench Biologists
- Bioinformaticians
- Computer Scientists
- Chemists
- Mathematicians
- Other
Introductions
- None -- that's what I'm here for!
- Some network analysis, but what's Cytoscape?
- I've played with Cytoscape, but still have a lot to learn.
- I use Cytoscape all the time...
(hey, I could probably teach this course!)
Introduction to Network Biology
Why Networks?
especially in biology!
- Molecular networks
- Cell-cell communication
- Nervous systems
- Social networks
especially in biology!
- Reduce complexity
- More efficient than tables
- Great for data integration
- Intuitive visualization
Networks as Tools
Transcription factors targeting apoptosis genes that bind MKRN1 in protein-mRNA network in embryonic stem cells.
One network figure conveys results from multiple technologies. Cassar, EMBO Reports 2015, Fig.8
Networks as Tools
- Topological properties
- Hubs and subnetworks
- Classify, cluster and diffuse
- Data integration
- Data overlays
- Layouts and animation
- Exploratory analysis
- Context and interpretation
Cassar, EMBO Reports 2015, Fig.8
Applications in Research

Applications in Research

- In 2010, a Nature Methods paper introduced major themes of network visualization.
- (a) Mass spec analysis: 400 PPI in pneumonia microbe.
- (b) Subnetwork with function annotations.
- (c) Layout with knowledge of complexes.
- (d) Collapsed metanodes to reduce complexity.
Gehlenborg (2010) Visualization of omics data for systems biology. Nature Methods, 7, Fig. 1
Applications in Research

- Study of interactions with ASD-associated proteins.
- Y2H with human protein fragments of 26 ASD proteins: 848 interacitons with 539 proteins.
- Merged with known interactions from public datasets.
Sakai (2011) Protein Interactome Reveals Converging Molecular Pathways Among Autism Disorders.
Science Trans. Med., 3(86), Fig. 1
Applications in Research

- SARS-CoV-2-human interactions.
- AP-MS with 26 SARS-CoV-2 proteins: 332 interactions human proteins.
- Merged human-human PPI datasets to identify complexes.
- Used fill color to highlight known drug targets.
Gordon (2020) A SARS-CoV-2 protein interaction map reveals targets for drug repurposing. Nature, 583, Fig. 3
Applications in Research

- Genetic interactions for the entire yeast genome.
- Synthetic lethal screen of 1712 genes: 170,000 interactions.
- Visualization of clustering within and between functional groups annotated by GO.
- Predict functions and identify regulatory subnetworks.
Costanzo (2010) The genetic landscape of a cell. Science, 22, Fig. 1
Applications in Research

- Molecular profiling of two types of brain tumors.
- GSEA to identify distinguishing gene sets (nodes).
- Functional annotation of a network of gene sets.
Witt (2011) Delineation of Two Clinically and Molecularly Distinct Subgroups of Posterior Fossa Ependymoma. Cancer Cell, 20(2), Fig. 4
Applications in Research

- TCGA's seriers of molecular cancer profiles.
- Clinical, genomic, methylation, RNA and proteomic signatures.
- Multiple data types integrated onto signaling network.
- Includes patient sample-level data.
TCGA (2013) Comprehensive molecular characterization of clear cell renal cell carcinoma. Nature, 499, Fig. 4
Applications in Research

Biological Network Taxonomy
- Metabolic
- Signaling
- Regulatory
- Disease
- Key distinctions:
- Pruned and curated
- Mechanistic and contextual details


Biological Network Taxonomy
- Protein-Protein
- Protein-Ligand
- Domain-Domain
- Others
- Residue or atomic
- Cell-cell
- Epidemiology
- Social networks


Biological Network Taxonomy
- Protein/Sequence Similarity Networks (PSNs or SSNs)
- Chemical similarity
- Ligand similarity (SEA)
- Others
- Tag clouds
- Topic maps


Biological Network Taxonomy
- Metabolic
- Signaling
- Regulatory
- Disease
- Interaction
- Physical, Genetic, Social
- Similarity
- Structural, Sequence, Topical
Cytoscape

- Open source
- Cross platform
- Consortium

Core Concepts
Networks and Tables

Networks
e.g., PPIs or pathways


Tables
e.g., data or annotations
Visual Styles
Core Concepts
Cytoscape Apps!
apps.cytoscape.org


Loading Network Data
- Cytoscape can import network data from:
- Files (or URLs)
- Excel, TSV, CSV
- XGMML: eXtensible Graph Markup and Modelling Language
- SBML: Systems Biology Markup Language
- BioPAX
- PSI-MI
- SIF: Simple Interaction Format
- GML: Graph Markup Language
- ... and others depending on loaded Apps
- Files (or URLs)
Loading Network Data
- Cytoscape can import network data from:
- Public repositories:
- PSICQUIC
- STRING (via the stringApp)
- IntAct (via the IntActApp)
- Reactome (via the ReactomeFI app)
- WikiPathways (via the WikiPathways app)
- Pathway Commons (via the CyPath2 app)
- NDEx
- Automation:
- Command line scripts
- CyREST via R, Python, etc
- Public repositories:
Loading Table Data
- Cytoscape can load tables from:
- Files (or URLs)
- Excel, TSV, CSV
- Public repositories
- BioMart
- Automation:
- Command line scripts
- CyREST via R, Python, etc
- Files (or URLs)
Saving and Exporting
- Sessions save everything as
.cys files:
Networks, Tables, Styles, Screen sizes, etc. - Export networks in different formats:
SIF, GML, XGMML, BioPAX, JSON - Export tables as CSV files
- Publication quality graphics in several formats:
PDF, SVG, PNG, and JPEG
Tour of Cytoscape
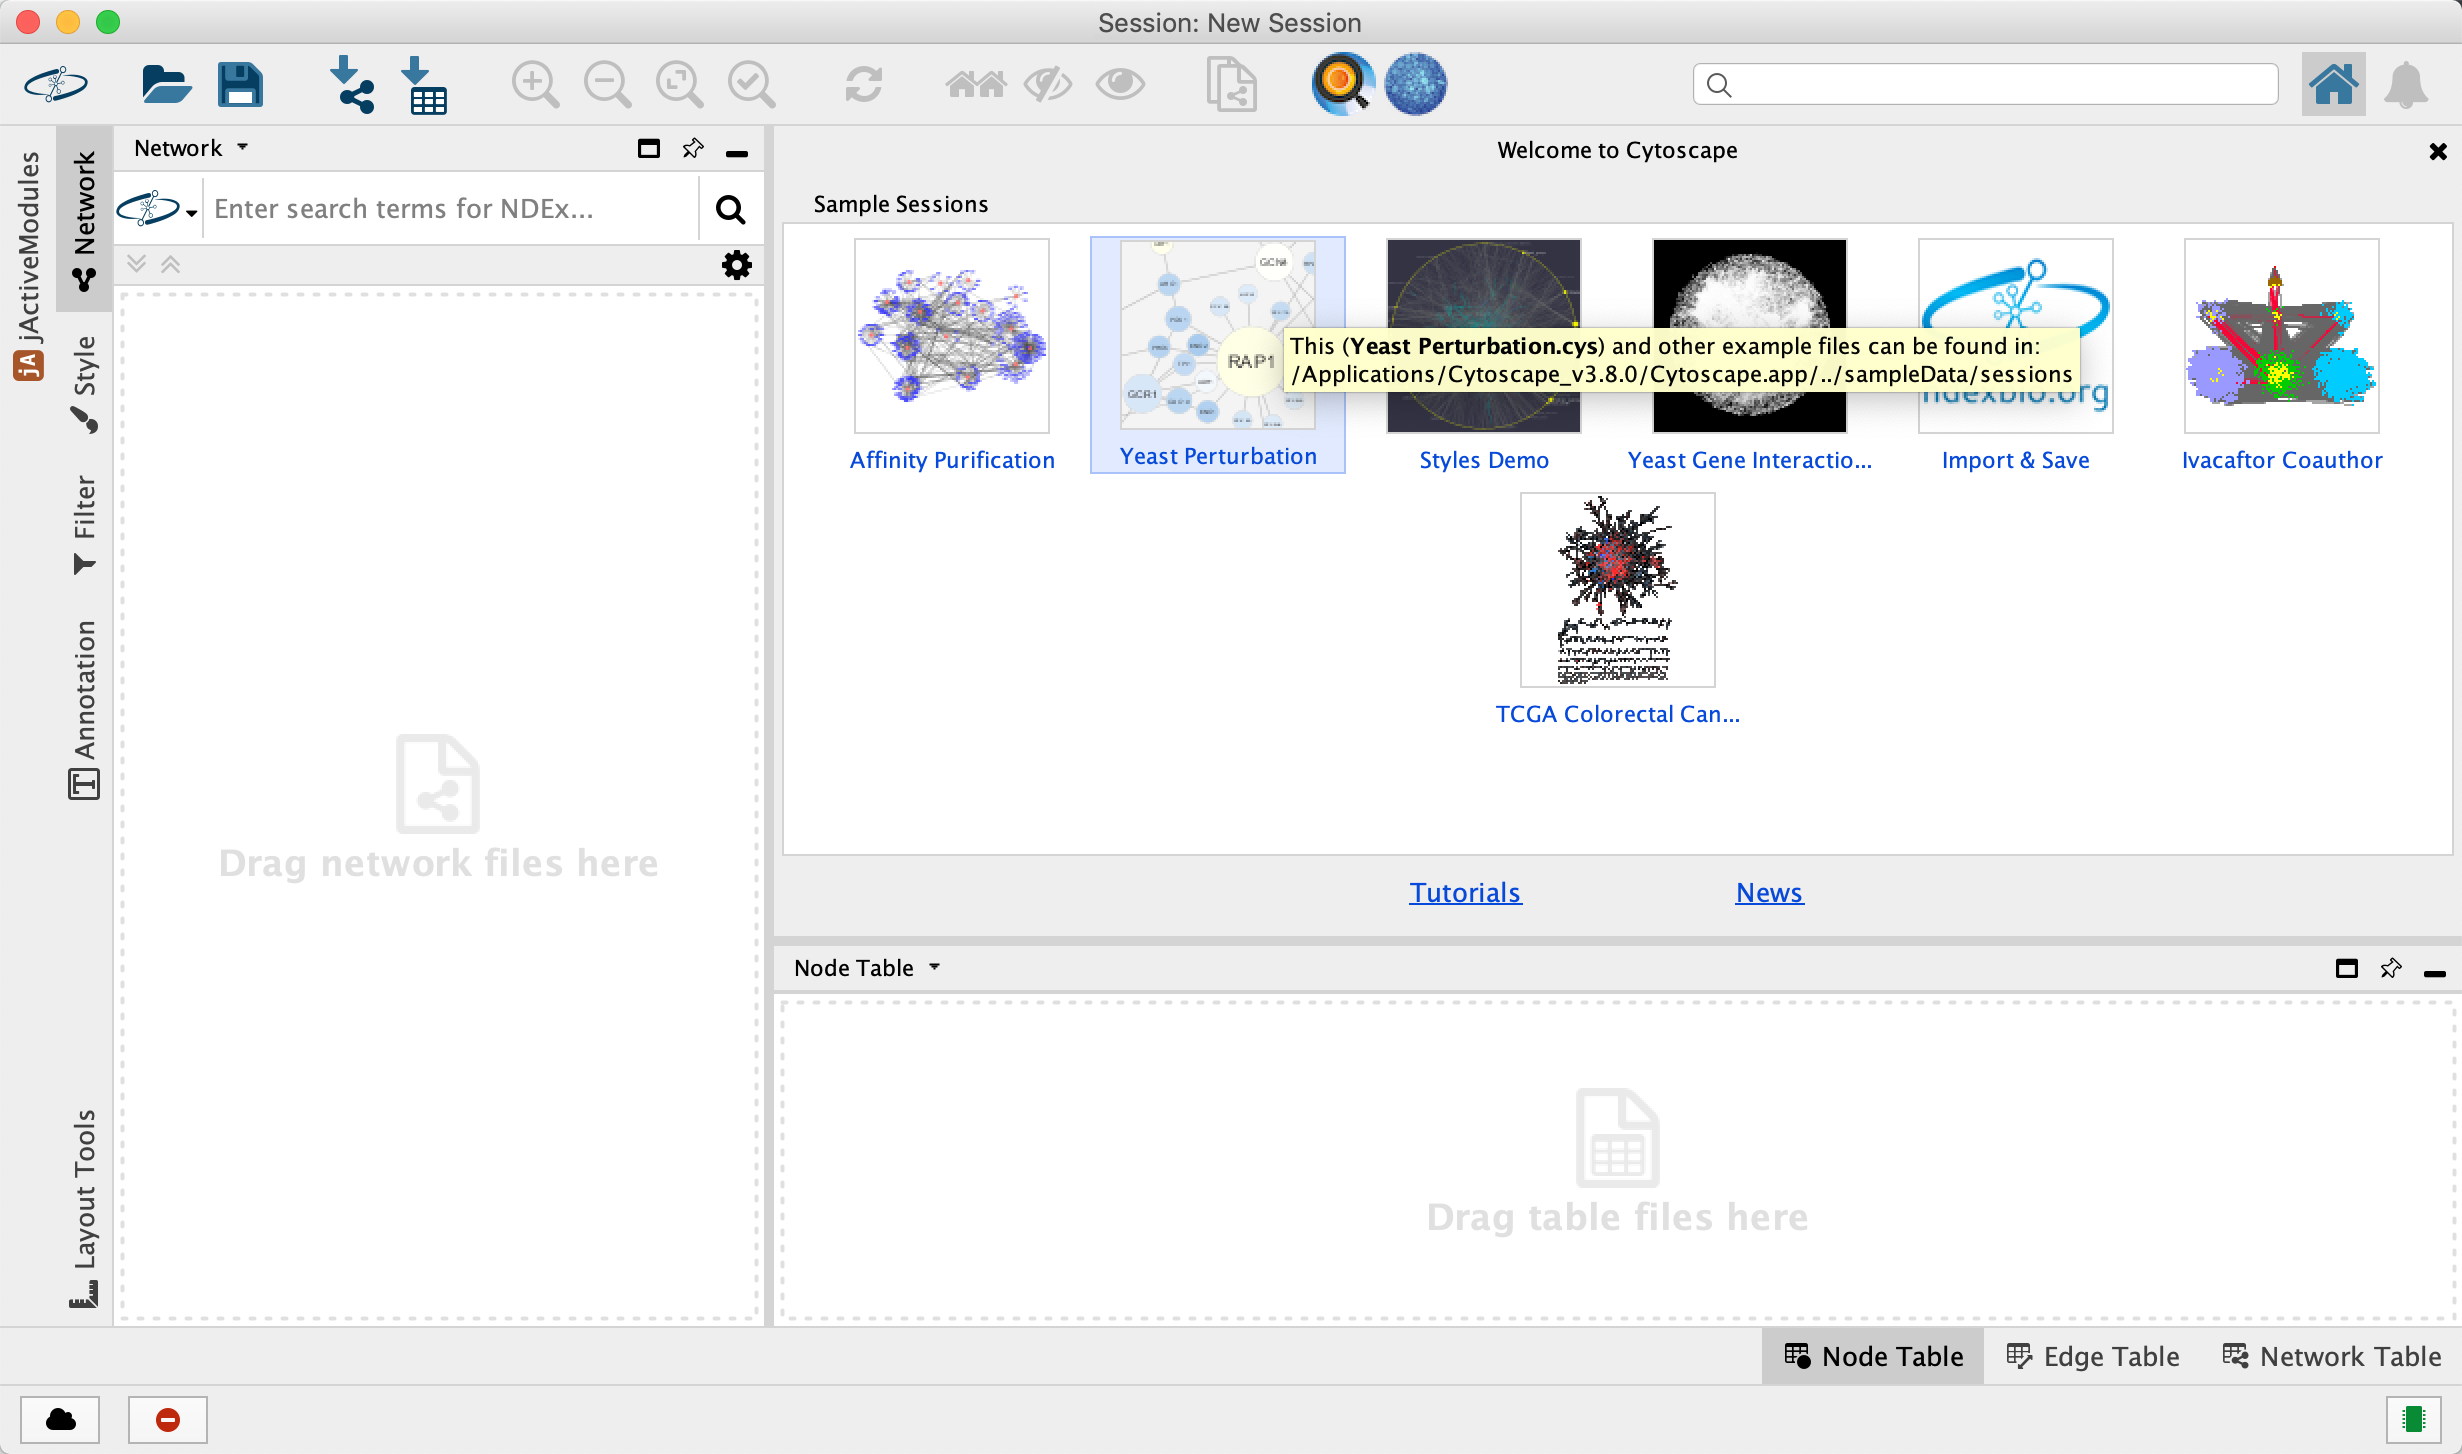
- Launch Cytoscape v3.7.0
Tour of Cytoscape
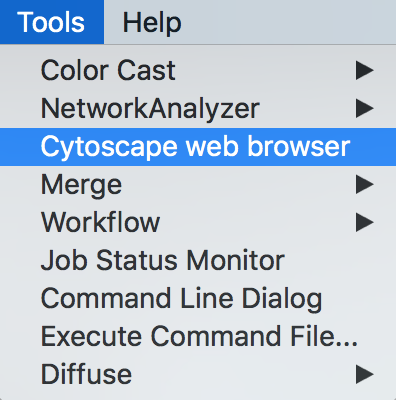
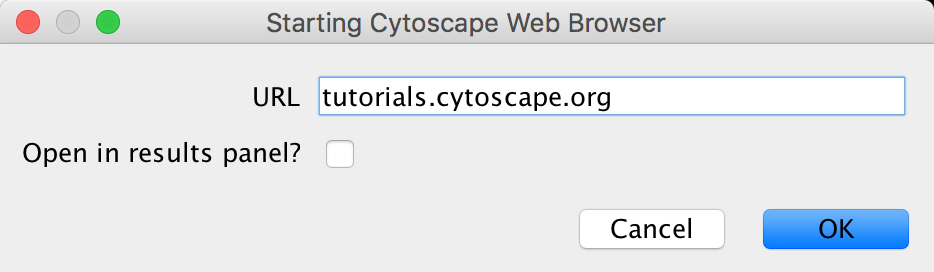
- Open CyBrowser
- Enter URL: tutorials.cytoscape.org
Tour of Cytoscape
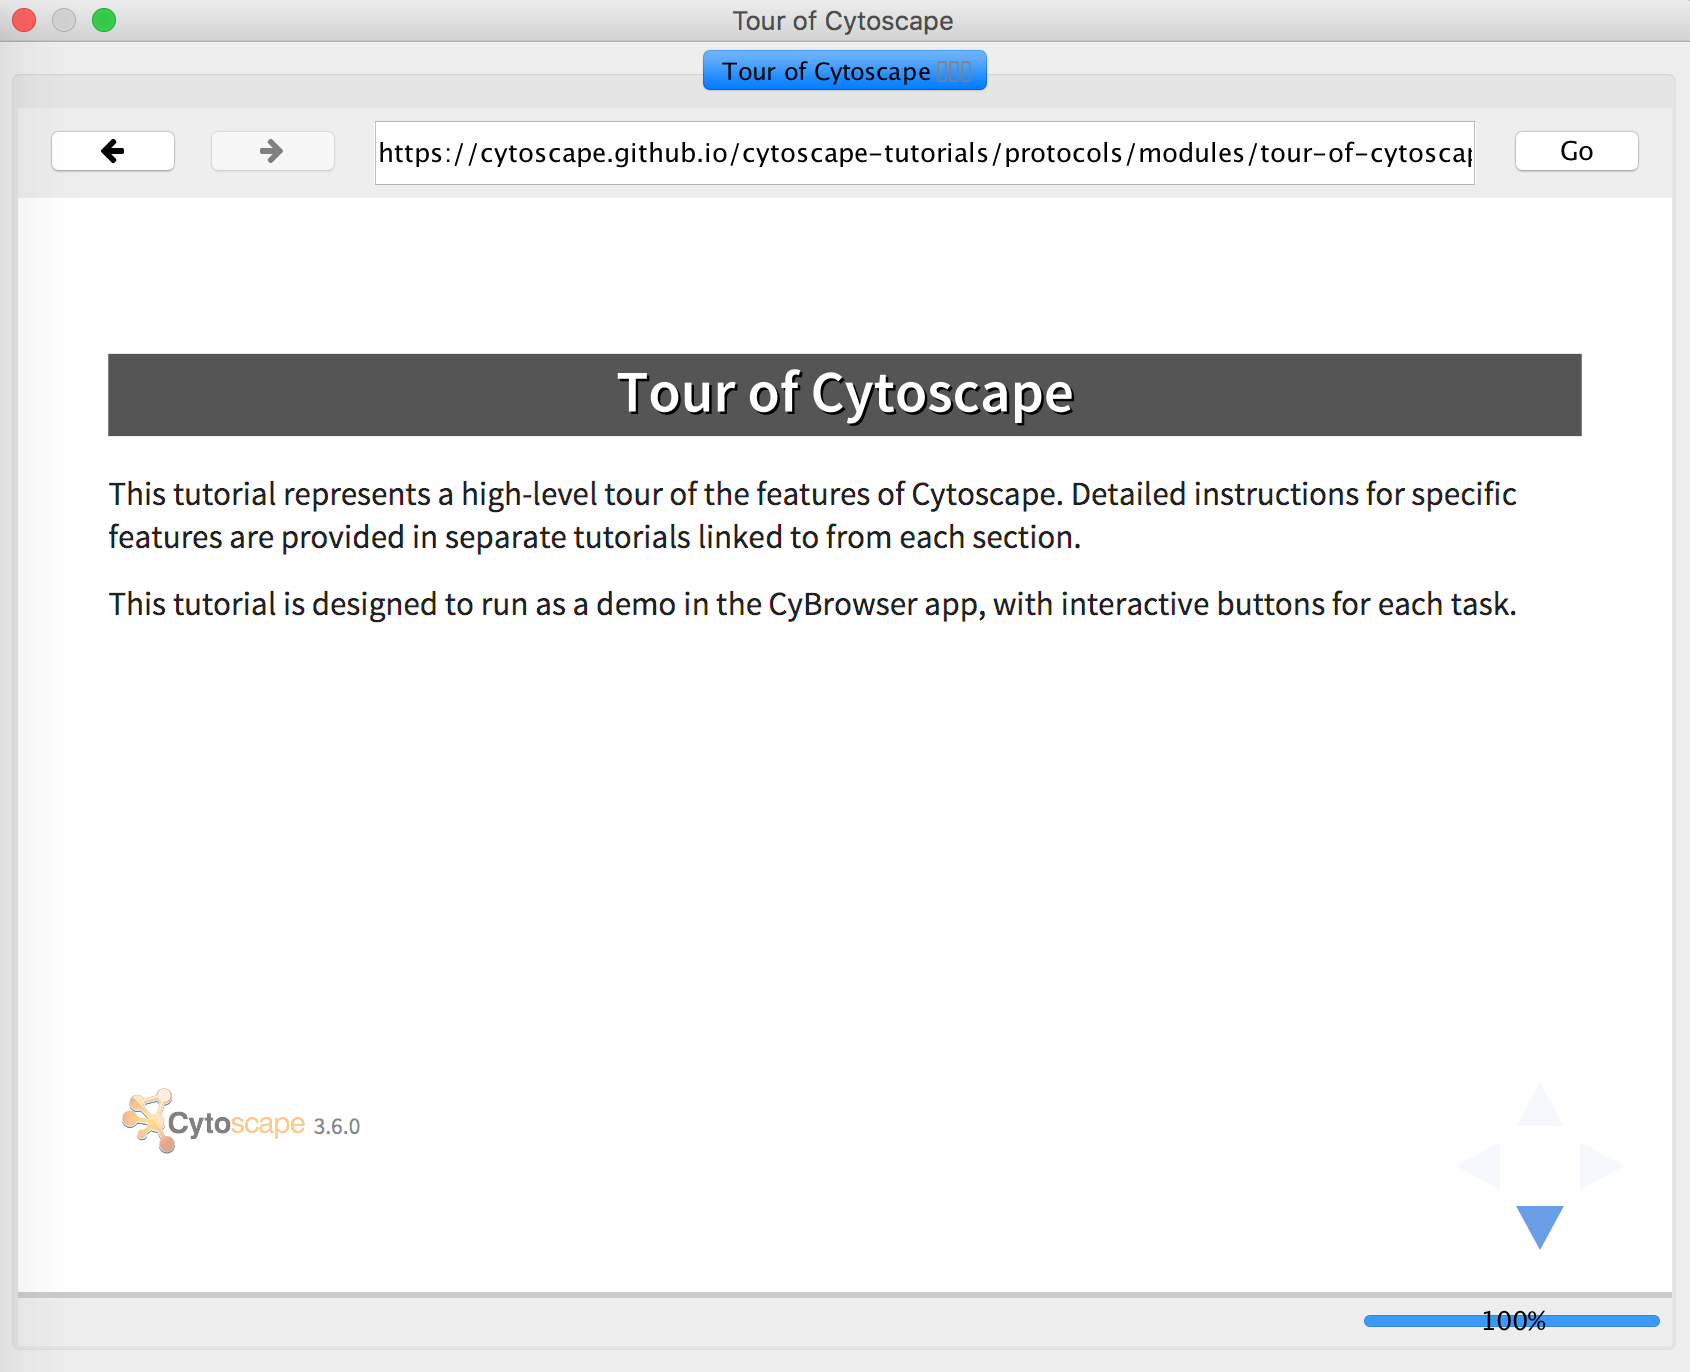
- Click on Tour of Cytoscape
- Resize window to your preference
Tour of Cytoscape
- Loading networks
- Loading tables
- Selection and filtering
- Changing visual attributes
- Exporting images
- Saving sessions
Hands-on Exercises
Other tutorials are available at: tutorials.cytoscape.org
Network Visualization
Depiction
- Various ways to depict biological networks:
- Node-Link (graph) representation
- Partitioned Node-Link representation
- Matrix representation
- Can be useful for very dense networks
- Can also map information into cells of matrix
- e.g. degree, color scale (heat map)


Data Mapping
- Mapping of data values associated with graph elements onto graph visuals
- Visual attributes
- Node fill color, border color, border width, size, shape, opacity, label
- Edge type, color, width, ending type, ending size, ending color
- Mapping types
- Continuous (numeric values)
- Discrete (categories)
- Passthrough (labels)


Data Mapping
- Avoid cluttering your visualization with too much data
- Highlight meaningful differences
- Avoid confusing the viewer
- Consider creating multiple network images

Layouts
- Layouts determine the location of nodes and (sometimes) the paths of edges
- Types:
- Simple
- Grid
- Hierarchical
- layout data as a tree or hierarchy
- Works best when there are no loops
- Circular (Radial)
- arrange nodes around a circle
- could use node attributes to govern position
- e.g. degree sorted
- Simple
- Types:


Layouts
- Types:
- Force-Directed
- simulate edges as springs
- may be weighted or unweighted
- Combining layouts
- Use a general layout (force directed) for the entire graph, but use hierarchical or radial to focus on a particular portion
- Multi-layer layouts
- Partition graph, layout each partition then layout partitions
- Many, many others
- Force-Directed


Layouts
- Manual tweaks with
Node Layout Tools - Scale
- Align
- Rotate

Layouts
- Use layouts to convey the relationships between the nodes.
- There is not one correct layout. Try different things.
- Layout algorithms may need to be “tuned” to fit your network.

Animation
- Animation is useful to show changes in a network:
- Over a time series
- Over different conditions
- Between species
Introduction to STRING
Cytoscape & STRING


When to Automate
- When you want to do something multiple times, e.g., loops
- When you want to reproduce work in the future
- When you want to share with colleagues or publish
- When you are already working on in R or Python
Automation Examples
Check out the expanding collection ofAutomation with RCy3

RCy3: Network biology using Cytoscape from within R. F1000Research 2019.
Automation References
Automation with Apps
Check out the growing collection of Cytoscape apps that support automation, and theCytoscape Apps for Automation
f1000research.com/gateways/cytoscapeapps/automation
Translating biological data into Cytoscape using RCy3 or py4cytoscape
Networks offer us a useful way to represent our biological data. But how do we seamlessly translate our data from R into Cytoscape?

Set up
In order to control Cytoscape from R/Python you need either:
RCy3 - a bioconductor package
                            #R
                            if(!"RCy3" %in% installed.packages()){
                                install.packages("BiocManager")
                                BiocManager::install("RCy3")
                            }
                            library(RCy3)
py4cytoscape - a pip package
                            #Python
                            pip install requests pandas colorbrewer chardet decorator
                            pip install py4cytoscape
                            import py4cytoscape as py4
Set up (part 2: Cytoscape)
- Download and install the latest version of Cytoscape.
- Then launch Cytoscape and verify communication
RCy3::cytoscapePing()
py4.cytoscape_ping()
[1] "You are connected to Cytoscape!"
Set up (part 3: apps)
You can install apps in Cytoscape directly from R/Python.
installApp("stringApp")
py4.install_app("stringApp")
[1] "App stringApp installed"
Browse available functions and arguments
Depending on what apps you have installed there is different functionality available.
To see all the functions available open the interactive Swagger docs:
                            cyrestAPI()  # CyREST API
                            commandsAPI()  # Commands API
                            py4.cyrest_api()  # CyREST API
                            py4.commands_api()  # Commands API
Cytoscape Basics
Create a Cytoscape network from data frames
nodes <- data.frame(id=c("node 0","node 1","node 2","node 3"),
                    group=c("A","A","B","B"), # categorical strings
                    score=as.integer(c(20,10,15,5)), # integers
                    stringsAsFactors=FALSE)
edges <- data.frame(source=c("node 0","node 0","node 0","node 2"),
                    target=c("node 1","node 2","node 3","node 3"),
                    interaction=c("inhibits","interacts","activates","interacts"),  # optional
                    weight=c(5.1,3.0,5.2,9.9), # numeric
                    stringsAsFactors=FALSE)
import pandas as pd
nodes = pd.DataFrame(data={'id': ["node 0", "node 1", "node 2", "node 3"],
                           'group': ["A","A","B","B"],
                           'age': [20,10,15,5]})

edges = pd.DataFrame(data={'source': ["node 0", "node 0", "node 0", "node 2"],
                           'target': ["node 1", "node 2", "node 3", "node 3"],
                           'interaction': ["inhibits","interacts","activates","interacts"],
                           'weight': [5.1,3.0,5.2,9.9]})
Data frame used to create Network
Nodes table:
| id | group | score |
|---|---|---|
| node 0 | A | 20 |
| node 1 | A | 10 |
| node 2 | B | 15 |
| node 3 | B | 5 |
Edges table:
| source | target | interaction | weight |
|---|---|---|---|
| node 0 | node 1 | inhibits | 5.1 |
| node 0 | node 2 | interacts | 3.0 |
| node 0 | node 3 | activates | 5.2 |
| node 2 | node 3 | interacts | 9.9 |
Create Network
createNetworkFromDataFrames(nodes, edges, title="my first network",
    collection="DataFrame Example")
py4.create_network_from_data_frames(nodes, edges, title="my first network",
    collection="DataFrame Example")

Export an image of the network
Remember: all networks we make are created in Cytoscape so get an image of the resulting network and include it in your current analysis if desired.
exportImage("my_first_network", type = "png")
py4.export_image("my_first_network", type = "png")

Export and embed an image in a notebook
With the new support for notebooks, you can also display exported images inline with notebooks, both offline and online, e.g., Jupyter/Colab.
notebookExportShowImage("my_first_network", type = "png")
py4.notebook_export_show_image("my_first_network", type = "png")
Wrap up
Questions and Discussion