Importing Data From Tables
Cytoscape supports the ability to link data to networks as node and edge attributes, enabling data-driven network visualization. This tutorial describes how to load expression data from a spreadsheet, and how to link it to already loaded networks.

Loading Network
- Launch Cytoscape
- We are going to use NDEx to get the network file. In the
Network Search interface in theControl Panel , select NDEx from the drop-down, and type in "GAL1 GAL4 GAL80". - In the search results, find the galFiltered network. Click the
Import network to Cytoscape icon to the left of the network name. - When the network first opens, the entire network may not visible because of the default zoom factor used. To see the whole network, select
View → Fit Content . - By default, the Prefuse Force Directed Layout is applied to organize the layout of the nodes. The default layout may be changed under
Layout → Settings .
Experimental Data Background
The data you are working with is from yeast, the genes Gal1, Gal4, and Gal80 are all yeast transcription factors. Your expression experiments all involve some perturbation of these transcription factor genes.
Gal1, Gal4, and Gal80 are also represented in your interaction network, where they are labeled according to yeast locus tags: Gal1 corresponds to YBR020W, Gal4 to YPL248C, and Gal80 to YML051W.
Data File Format
- Using a text editor, open the file galExpData.csv to view the first few lines. This sample file is also included with your Cytoscape installation directory, under sampleData.
GENE,COMMON,gal1RGexp,gal4RGexp,gal80Rexp,gal1RGsig,gal4RGsig,gal80Rsig
YHR051W,COX6,-0.034,0.111,-0.304,3.75720e-01,1.56240e-02,7.91340e-06
YHR124W,NDT80,-0.090,0.007,-0.348,2.71460e-01,9.64330e-01,3.44760e-01
YKL181W,PRS1,-0.167,-0.233,0.112,6.27120e-03,7.89400e-04,1.44060e-01
Note the following information about the file:
- The first line consists of column labels.
- All columns are separated by a single comma character.
- The first column contains node names, and must match the names of the nodes in your network exactly!
- The second column contains common locus names. This column is optional, the data is not used by Cytoscape, but including this column makes the format consistent with the output of many analysis packages, and makes the file easier to read.
- The remaining columns contain experimental data, two columns per experiment (one for expression measurement and a second for corresponding significance value), and one line per node. In this case, there are three expression results per node.
Loading Data Table
There are two ways to initiate data import in Cytoscape:
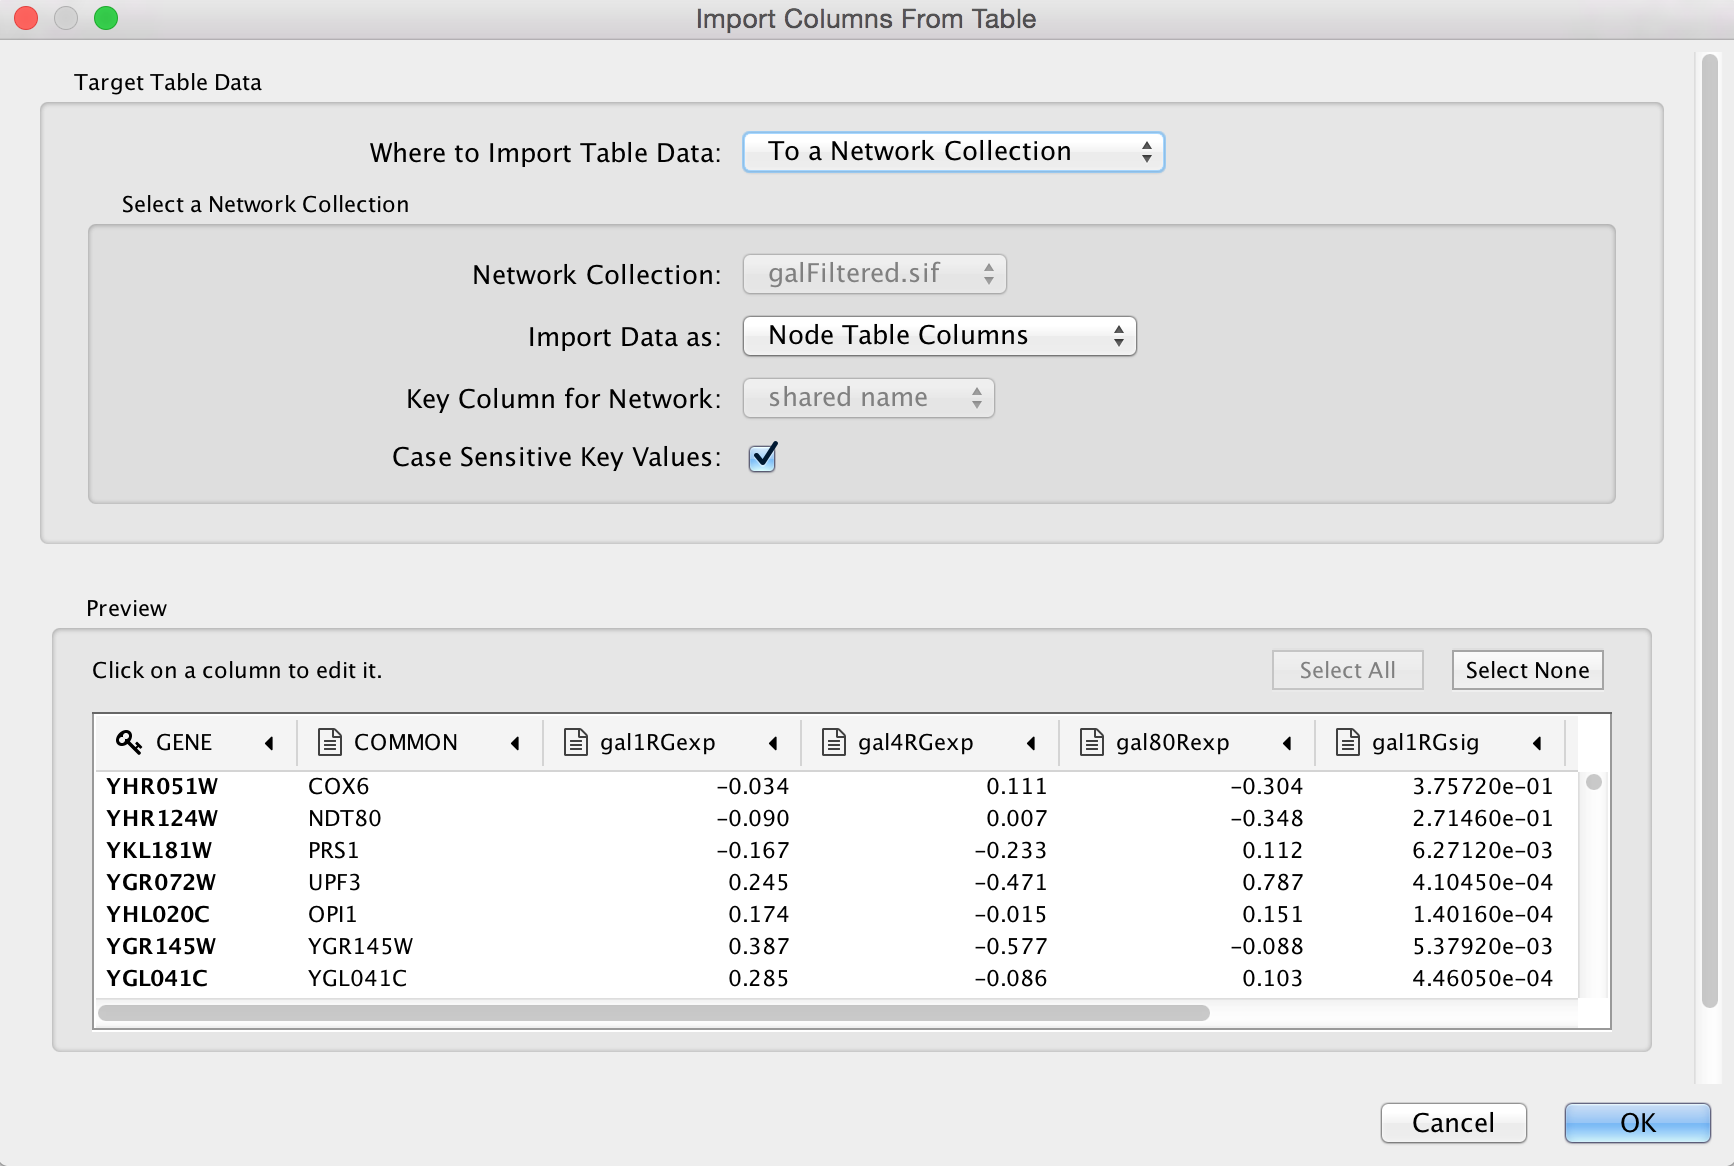
- Via the File menu: Load the galExpData.csv file under
File menu, selectImport → Table from File.... - Drag and drop: Drag and drop the galExpData.csv file onto the
Node Table .
The default settings are usually correct, although you may need to change the Key column to indicate which column will be used to match with the network key column.
Now you should see expression values listed in new columns in the
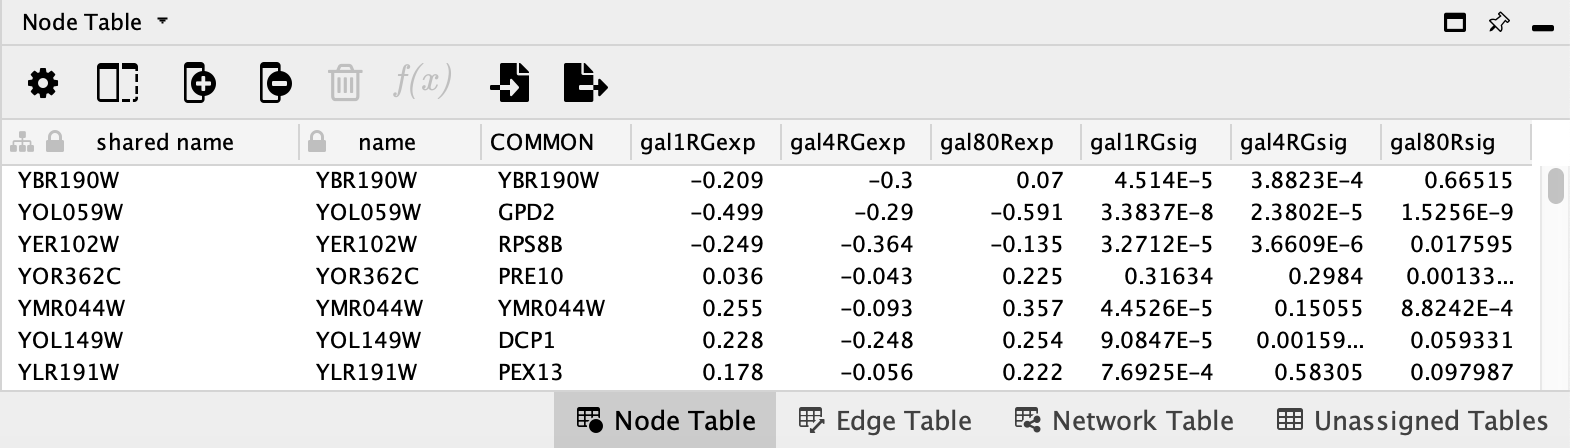
- Select a node in the network and the table will update to show only the corresponding row.
- You can limit the columns shown by clicking on the
Show Columns button and selecting columns.