Pathway enrichment analysis and visualization of omics data using g:Profiler, GSEA and Enrichment Map in Cytoscape
This step-by-step protocol explains how to complete pathway enrichment analysis using g:Profiler (filtered gene list) and GSEA (unfiltered, whole genome, ranked gene list), followed by visualization and interpretation using EnrichmentMap.
- g:Profiler
- - is a web-based thresholded pathway enrichment tool
- Gene Set Enrichment Analysis(GSEA)
- - is a desktop application that analyzes ranked gene lists using a permutation-based test
- EnrichmentMap
- - is a Cytoscape app that visualizes the results from pathway enrichment analysis

Software Requirements
- A contemporary web browser (e.g. Chrome) for pathway enrichment analysis with g:Profiler.
- Java Standard Edition required to run GSEA and Cytoscape.
- GSEA desktop application for pathway enrichment analysis.
- Cytoscape desktop application required for enrichment map visualization. Refer to the manual for a basic introduction.
- The following Cytoscape apps:
- EnrichmentMap- version 3.1 or higher,
- clusterMaker2- version 0.9.5 or higher,
- WordCloud- version 3.1.0 or higher,
- AutoAnnotate- version 1.2.0 or higher.
- The above can be conveniently downloaded and installed together by installing the “EnrichmentMap Pipeline Collection” from the Cytoscape App Store.
Data
We provide downloadable example files referred throughout the protocol (You can also download all the data file at once here. We recommend saving all these files in a personal project data folder before starting. We also recommend creating an additional result data folder to save the files generated while performing the protocol.
- A gene list (g:Profiler)
- A list of genes with frequent somatic single nucleotide variants (SNVs) identified in The Cancer Genome Atlas (TCGA) exome sequencing data of 3,200 tumors of 12 types.The MuSiC cancer driver mutation detection software was used to find 127 cancer driver genes that displayed higher than expected mutation frequencies in cancer samples. Genes are ranked in decreasing order of significance (FDR q-value) and mutation frequency
- Supplementary_Table1_Cancer_drivers.txt
Data - continued
- A ranked gene list of interest(GSEA)
- A list of differentially expressed genes in two subtypes of ovarian cancer defined by TCGA.
- An RNK file is a two-column text file with gene IDs in the first column and gene scores in the second column. All (or most) genes in the genome need to have a score and the gene IDs need to match those used in the GMT file.
- Supplementary_Table2_MesenvsImmuno_RNASeq_ranks.rnk
- Pathway gene set database(Baderlab genesets)
- Contains a database of pathway gene sets used for pathway enrichment analysis in the standard GMT format, downloaded from http://baderlab.org/GeneSets. This file contains pathways downloaded on July 1, 2017 from eight data sources: Gene Ontology, Reactome, Panther, NetPath, NCI, MSigDB curated gene sets (C2 collection, excluding Reactome and KEGG), MSigDB Hallmark (H collection) and HumanCyc.
- A GMT file is a text file where every line represents a gene set for a single pathway. Each line includes a pathway ID, name and the list of associated genes in a tab-separated format.
- Supplementary_Table3_Human_GOBP_AllPathways_no_GO_iea_July_01_2017_symbol.gmt
Setup
Dowanload and install the required software. Download the required input and output files from the supplementary materials of the protocol.
- Download the required input and output files from the supplementary materials of the protocol.
- Create two directories, project data folder and results data folder.
- Place all downloaded input and example output files into the project data folder.
- As you progress through the protocol place any newly generated files into the results data folder.
- Install Java Version 8 or higher if not already installed.
- Download the latest version of GSEA. We recommend the javaGSEA desktop application.(Free registratio is required)
- Download the latest version of Cytoscape. Cytoscape version 3.6.0 or higher is required.
Cytoscape Setup
- Launch Cytoscape. Refer to the manual for a basic introduction.
- Go to Apps --> App Store --> Show App Store.
- In the search bar, search for “EnrichmentMap”.
- In the results in the web browser, select the
EnrichmentMap Pipeline Collection . Verify that it is version 1.0.0 or higher.- Click on the Install button.
- Back in Cytoscape, check the list Installed Apps and verify that the apps (EnrichmentMap, clusterMaker2, WordCloud and AutoAnnotate) have been installed.
Determine best Pathway Analysis Method
Two major types of gene lists are used in pathway enrichment analysis of omics data. Select A or B, depending on the type of gene list you have.
A. Flat (unranked) gene lists
- g:Profiler
- a statistical threshold is required.
- Partial, filtered ranked gene lists can also be analyzed with g:Profiler.
- Alternate tools: David, ToppGene, Enrichr, GREAT, EnrichmentTable
6A. Pathway enrichment analysis of a gene list using g:Profiler
- Open g:Profiler
- Launch Browser
- Open the g:Profiler website at http://biit.cs.ut.ee/gprofiler/
6A. g:Profiler - Input data and set parameters
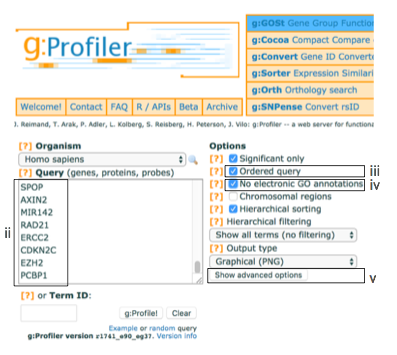
- Paste the gene list (gprofiler_genelist_Cancer_drivers.txt) into the Query field in top-left corner of the screen.
- Check the box next to Ordered query.
- Check the box next to No electronic GO annotations.
- Click on Show Advanced Options
6A. g:Profiler - Input data and set parameters - cont'd
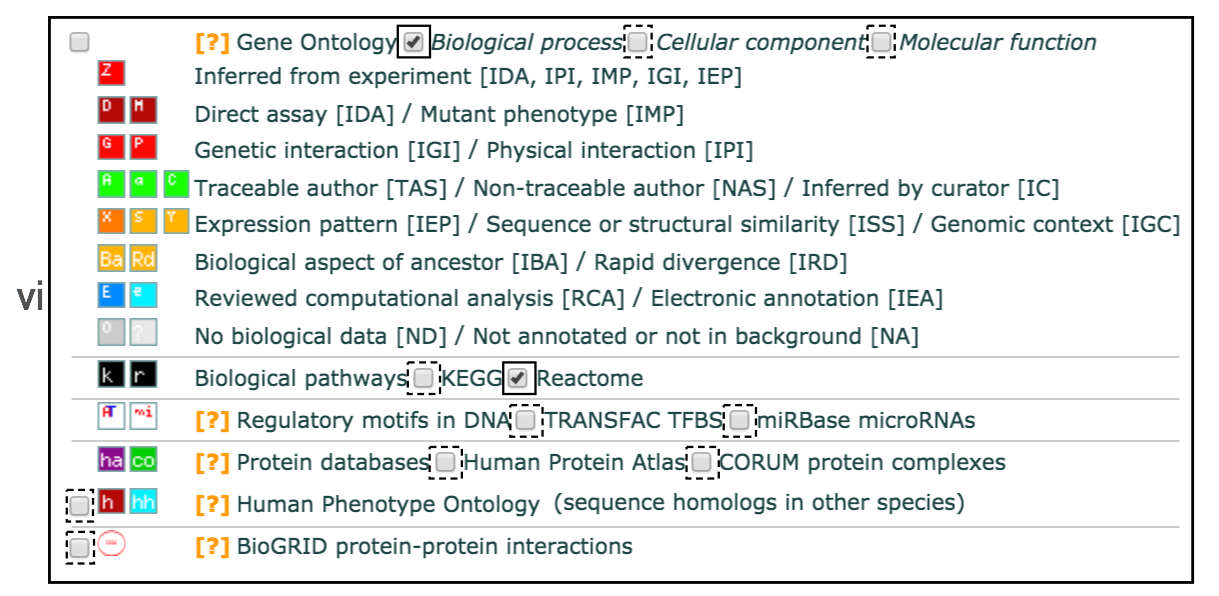
- Set filters on gene annotation data using the legend on the right. We recommend that initial pathway enrichment analyses only includes biological processes (BP) of GO and molecular pathways of Reactome. Keep the two checkboxes checked and uncheck all other boxes in the legend.
6A. g:Profiler - Input data and set parameters - cont'd
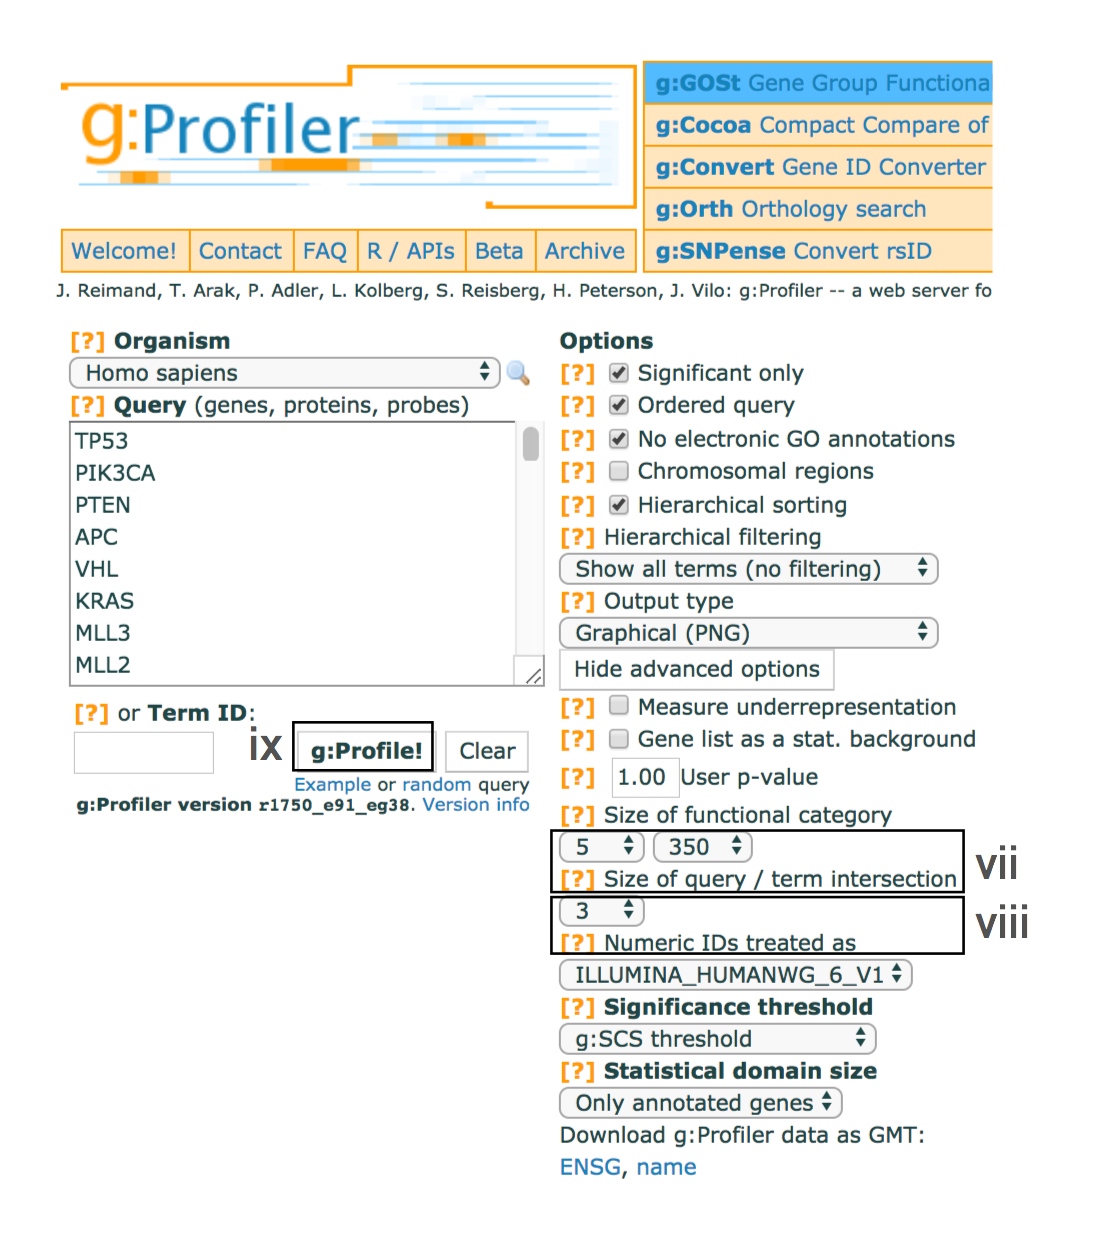
- Set the dropdown values of Size of functional category to
5 (‘min’) and350 (‘max’) . Large pathways are of limited interpretative value, while numerous small pathways decrease the statistical power because of excessive multiple testing. - Set the dropdown Size of query/term intersection to
3 . The analysis will only consider more reliable pathways that have three or more genes in the input gene list. - Click g:Profile! to run the analysis.
- A graphical heat map image will be shown with detected pathways shown along the y axis (left) and associated genes of the input list shown along the x axis (top). Resulting pathways are organized hierarchically into related groups.
- g:Profiler returns only statistically significant pathways with p-values adjusted for multiple testing correction (called q-values).
- By default, results with q-values below 0.05 are reported.
6A. g:Profiler - Input data and set parameters - cont'd
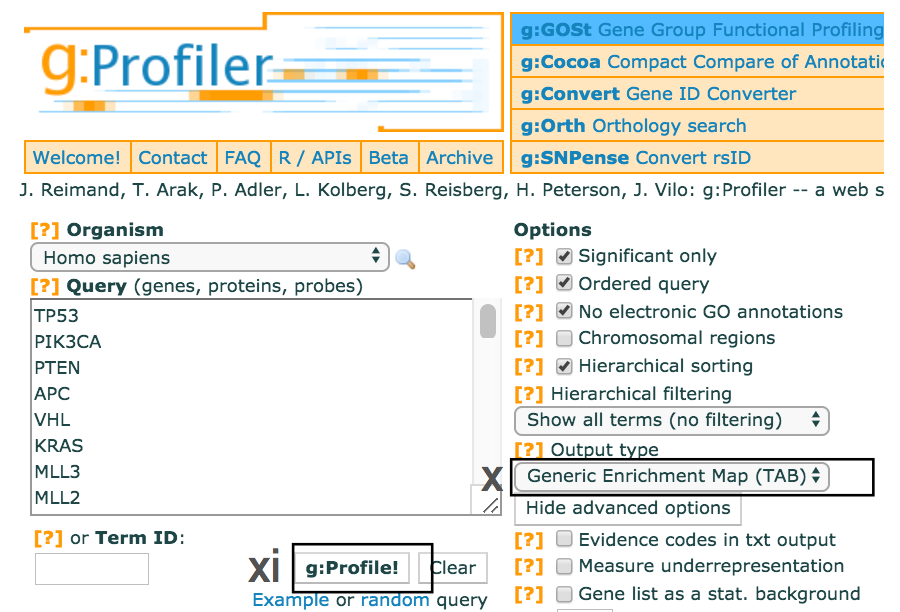
- Use the dropdown menu Output type and select the option
Generic Enrichment Map (TAB) . This file is required for visualizing pathway results with Cytoscape and EnrichmentMap. - Click g:Profile! again to run the analysis with the updated parameters.
- The required link Download data in Generic Enrichment Map (GEM) format will appear under the g:Profiler interface.
6A. g:Profiler - Input data and set parameters - cont'd
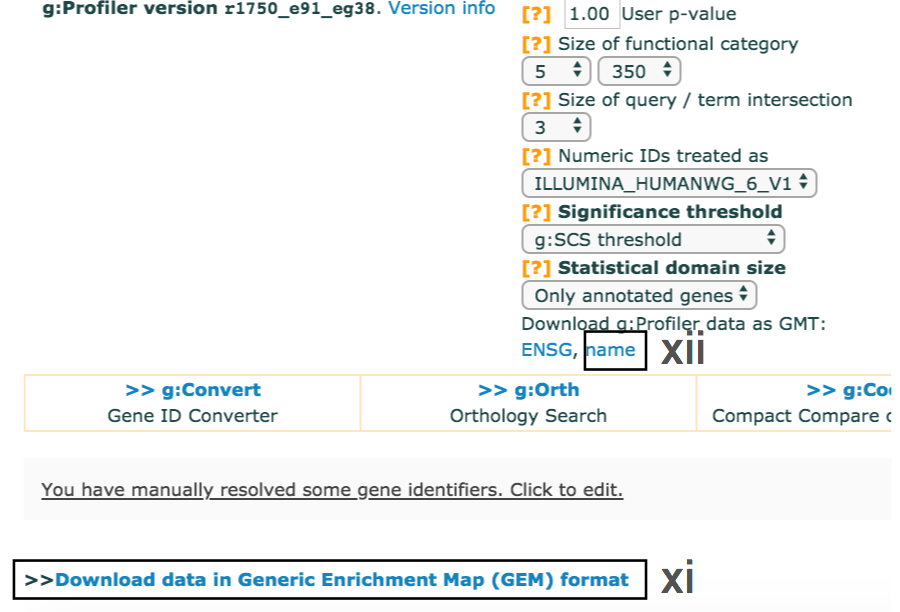
- cont'd - Download enrichment file.
- Download the file from the link and save it on your computer in your result data folder created in Step 1i. Example results are provided in Supplementary_Table4_gprofiler_results.txt.
- Download the required GMT file by clicking on the link name at the bottom of the Advanced Options form. The GMT file is a compressed ZIP archive that contains all gene sets used by g:Profiler (e.g., gprofiler_hsapiens.NAME.gmt.zip).
- The gene set files are divided by data source.
- Download and uncompress the ZIP archive to your project folder.
- All required gene sets for this analysis will be in the file hsapiens.pathways.Name.gmt (Supplementary_Table5_hsapiens.pathways.NAME.gmt).
- Place the saved file in your result data folder created in Step 1i.
6B. Pathway enrichment analysis of a ranked gene list using GSEA
- Launch GSEA by opening the downloaded GSEA file (gsea.jnlp)
Troubleshooting - GSEA launch
- macOS for the first time,
- error “gsea.jnlp cannot be opened because it is from an unidentified developer”.
- Click on “Ok”.
- Instead of double clicking on the gsea.jnlp icon/file, right click and select “open”.
- The same error will appear but this time it will give you the option to “Open” or “Cancel”. Click on “Open”.
- After this initial opening, subsequent double clicks on gsea.jnlp will launch GSEA without errors or warnings.
- If GSEA still fails to launch through the Java Web Start downloaded from the GSEA website,
- GSEA can alternatively be launched from the command line.
- Go to the GSEA download site and download javaGSEA JAR file.
- Open a command line terminal.
- navigate to the directory where the file javaGSEA.jar was downloaded.
- Run the command "java –Xmx4G –jar gsea-3.0.jar".
6B. Pathway enrichment analysis of a ranked gene list using GSEA - cont'd
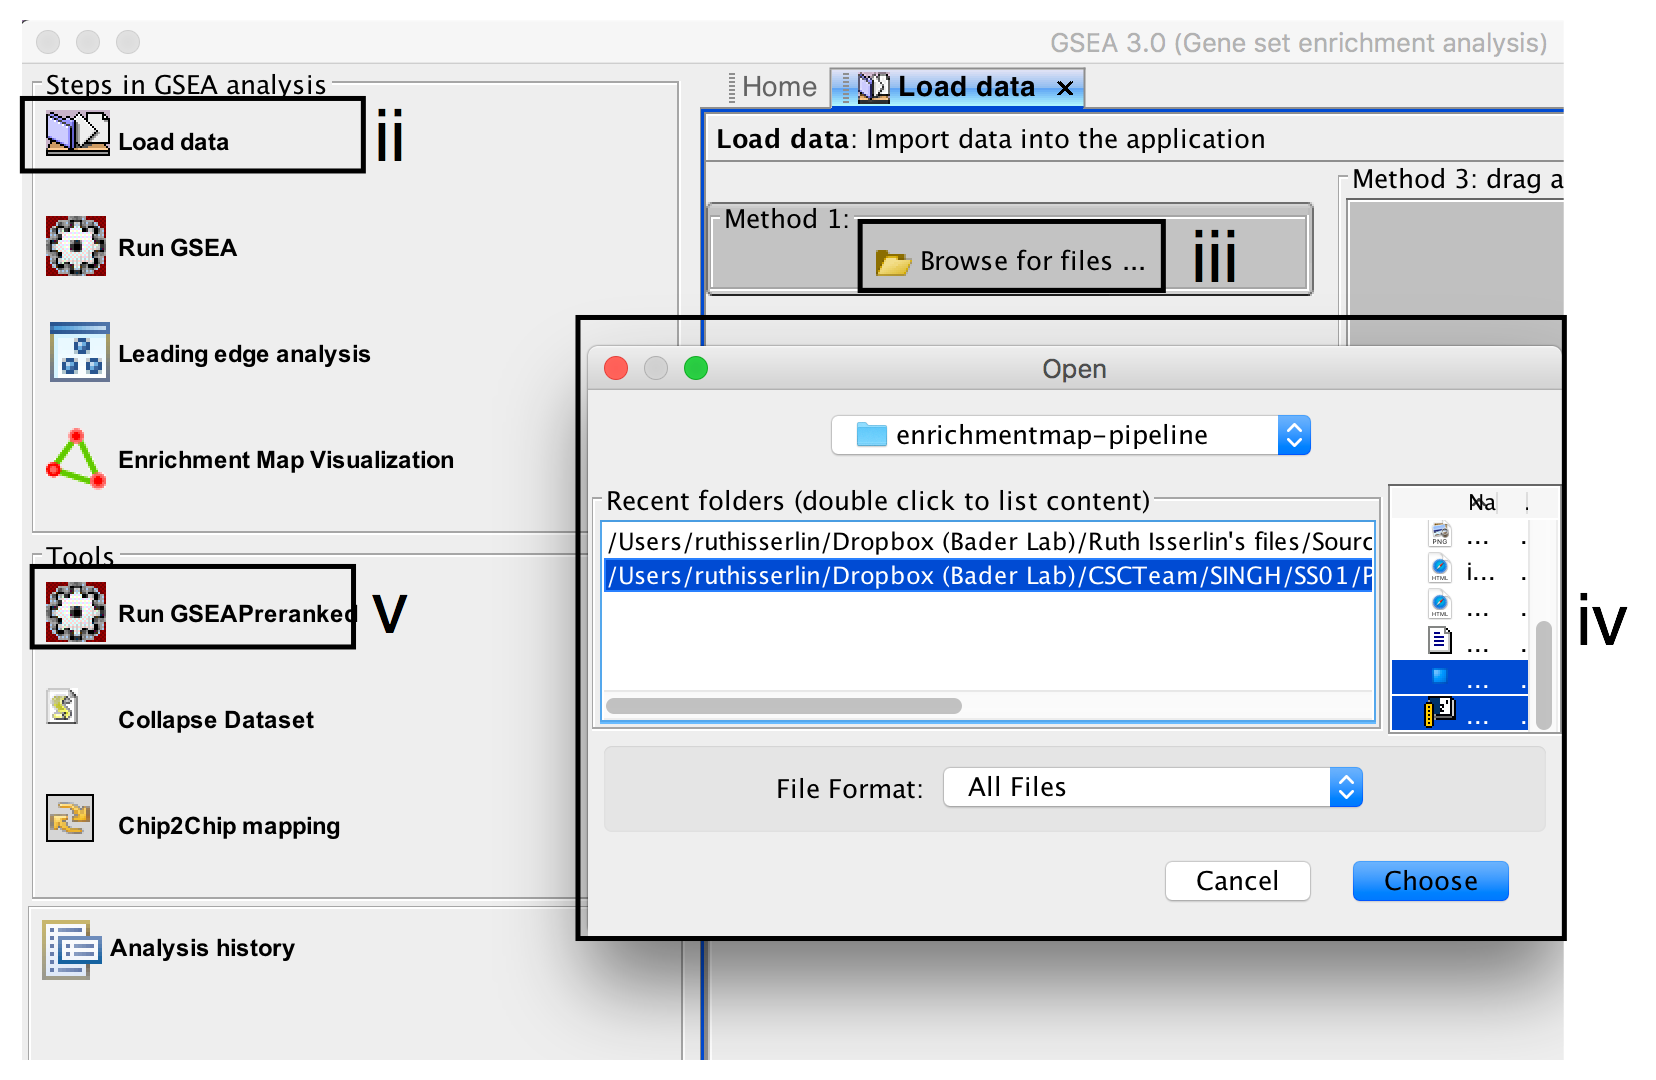
- Click on Load Data in the top left corner in the Steps in GSEA Analysis section.
- In the Load Data tab, click on Browse for files …
- Find your project data folder and select the file ranked genelist file.
- Also select the pathway gene set definition (GMT) file using a multiple select method such as shift-click (genesets gmt file).
- Click the Choose button to continue.
- A message box indicates that the files were loaded successfully. Click the OK button to continue.
- Click on Run GSEAPreranked in the side bar under Tools.
Troubleshooting - GMT files
- TROUBLESHOOTING: GSEA may seem non-responsive but it is actually loading in large files.
- Possible reason:Large GMT file
- It may take 5-10 seconds for GSEA to load input files. The files are loaded successfully once a message appears on the screen “Files loaded successfully: 2/2. There were no errors”.
- TROUBLESHOOTING: How to use MSigdb or alternate GMT files.
- GSEA also supplies its own gene set files that are accessible directly through the GSEA interface from the MSigDB resource.
- These files do not need to be imported into GSEA. When you define the GMT file, the MSigDB gene set files can be found in the first tab “Gene Matrix (from website)” of the “Select one or more genesets” dialog. The latest versions of the MSigDB gene set files are in bold but previous versions can also be accessed. To select multiple gene set files, use multi-file select by simultaneously clicking on the desired files and holding the control key on Windows or command on macOS.
6B. Pathway enrichment analysis of a ranked gene list using GSEA - cont'd
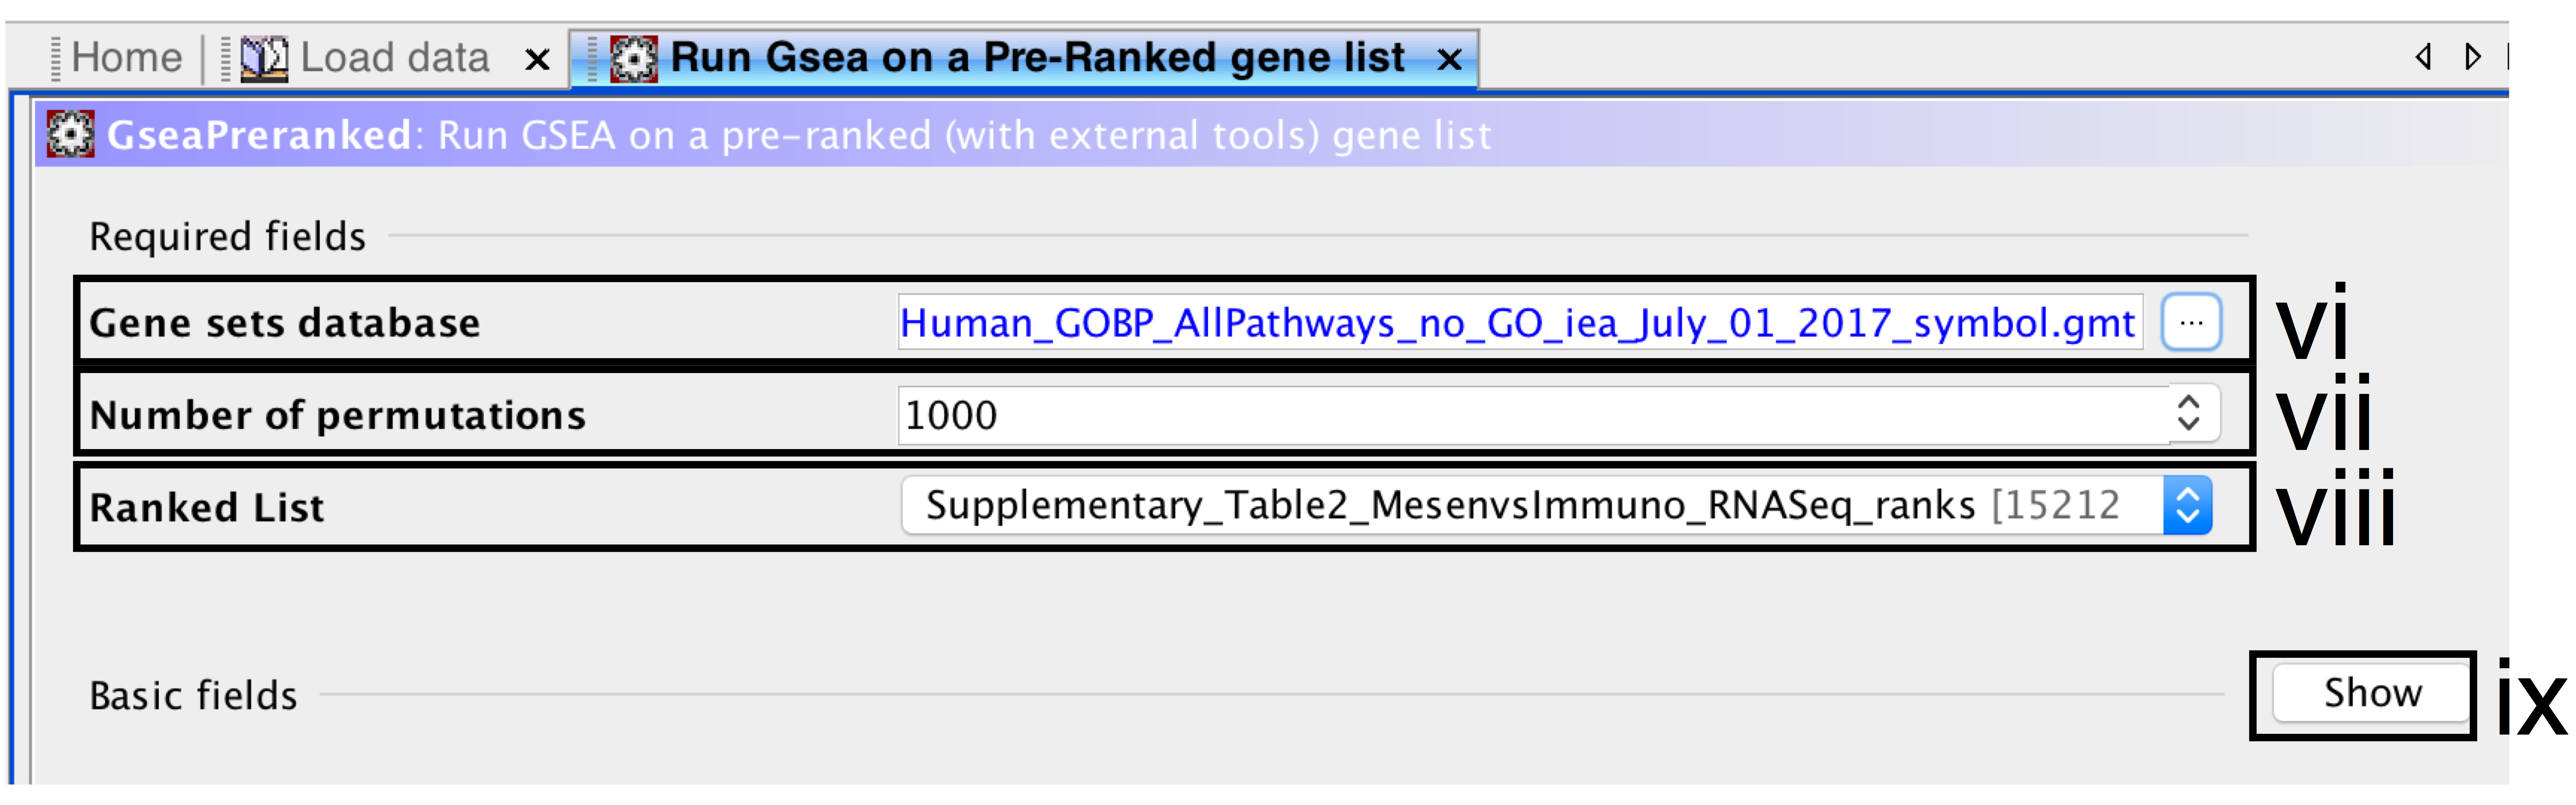
- Gene sets database –
- click on the button (…) located to the right and wait a few seconds for the gene set selection window to appear.
- Go to the Gene matrix (local gmx/gmt) tab using the top right arrow.
- Click on the downloaded local GMT file Supplementary_Table3_Human_GOBP_AllPathways_no_GO_iea_July_01_2017_symbol.gmt(click for info on data files) and click on OK at the bottom of the window.
-
- Number of permutations – number of times that the gene sets will be randomized to create the null distribution to calculate the p-value and FDR q-value. Use the default value of 1000 permutations.
- Ranked List – select the ranked gene list by clicking on the right-most arrows and highlighting the rank file(Supplementary_Table2_MesenvsImmuno_RNASeq_ranks.rnk)(click for info on data files).
- Click the Show button next to Basic fields to display extra options.
Troubleshooting - Permutations
- TROUBLESHOOTING: Increasing the number of permutations will increase computation time.
- The higher the number of permutations, the longer the analysis will take.
- To calculate the FDR q-value for each gene set, the data is randomized by permuting the genes in each gene set and recalculating the p-values for the randomized set. This parameter specifies how many times this randomization is done.
- The more randomizations are performed, the more precise the FDR q-value estimation will be (to a limit, as eventually the FDR q-value will stabilize at the actual value). On a Windows machine with 16G of RAM and i7 3.4 GHz processor, an analysis with 10, 100, 500, or 1000 randomizations on our example set with above defined parameters takes 155, 224, 544, and 1012 seconds, respectively.
6B. Pathway enrichment analysis of a ranked gene list using GSEA - cont'd
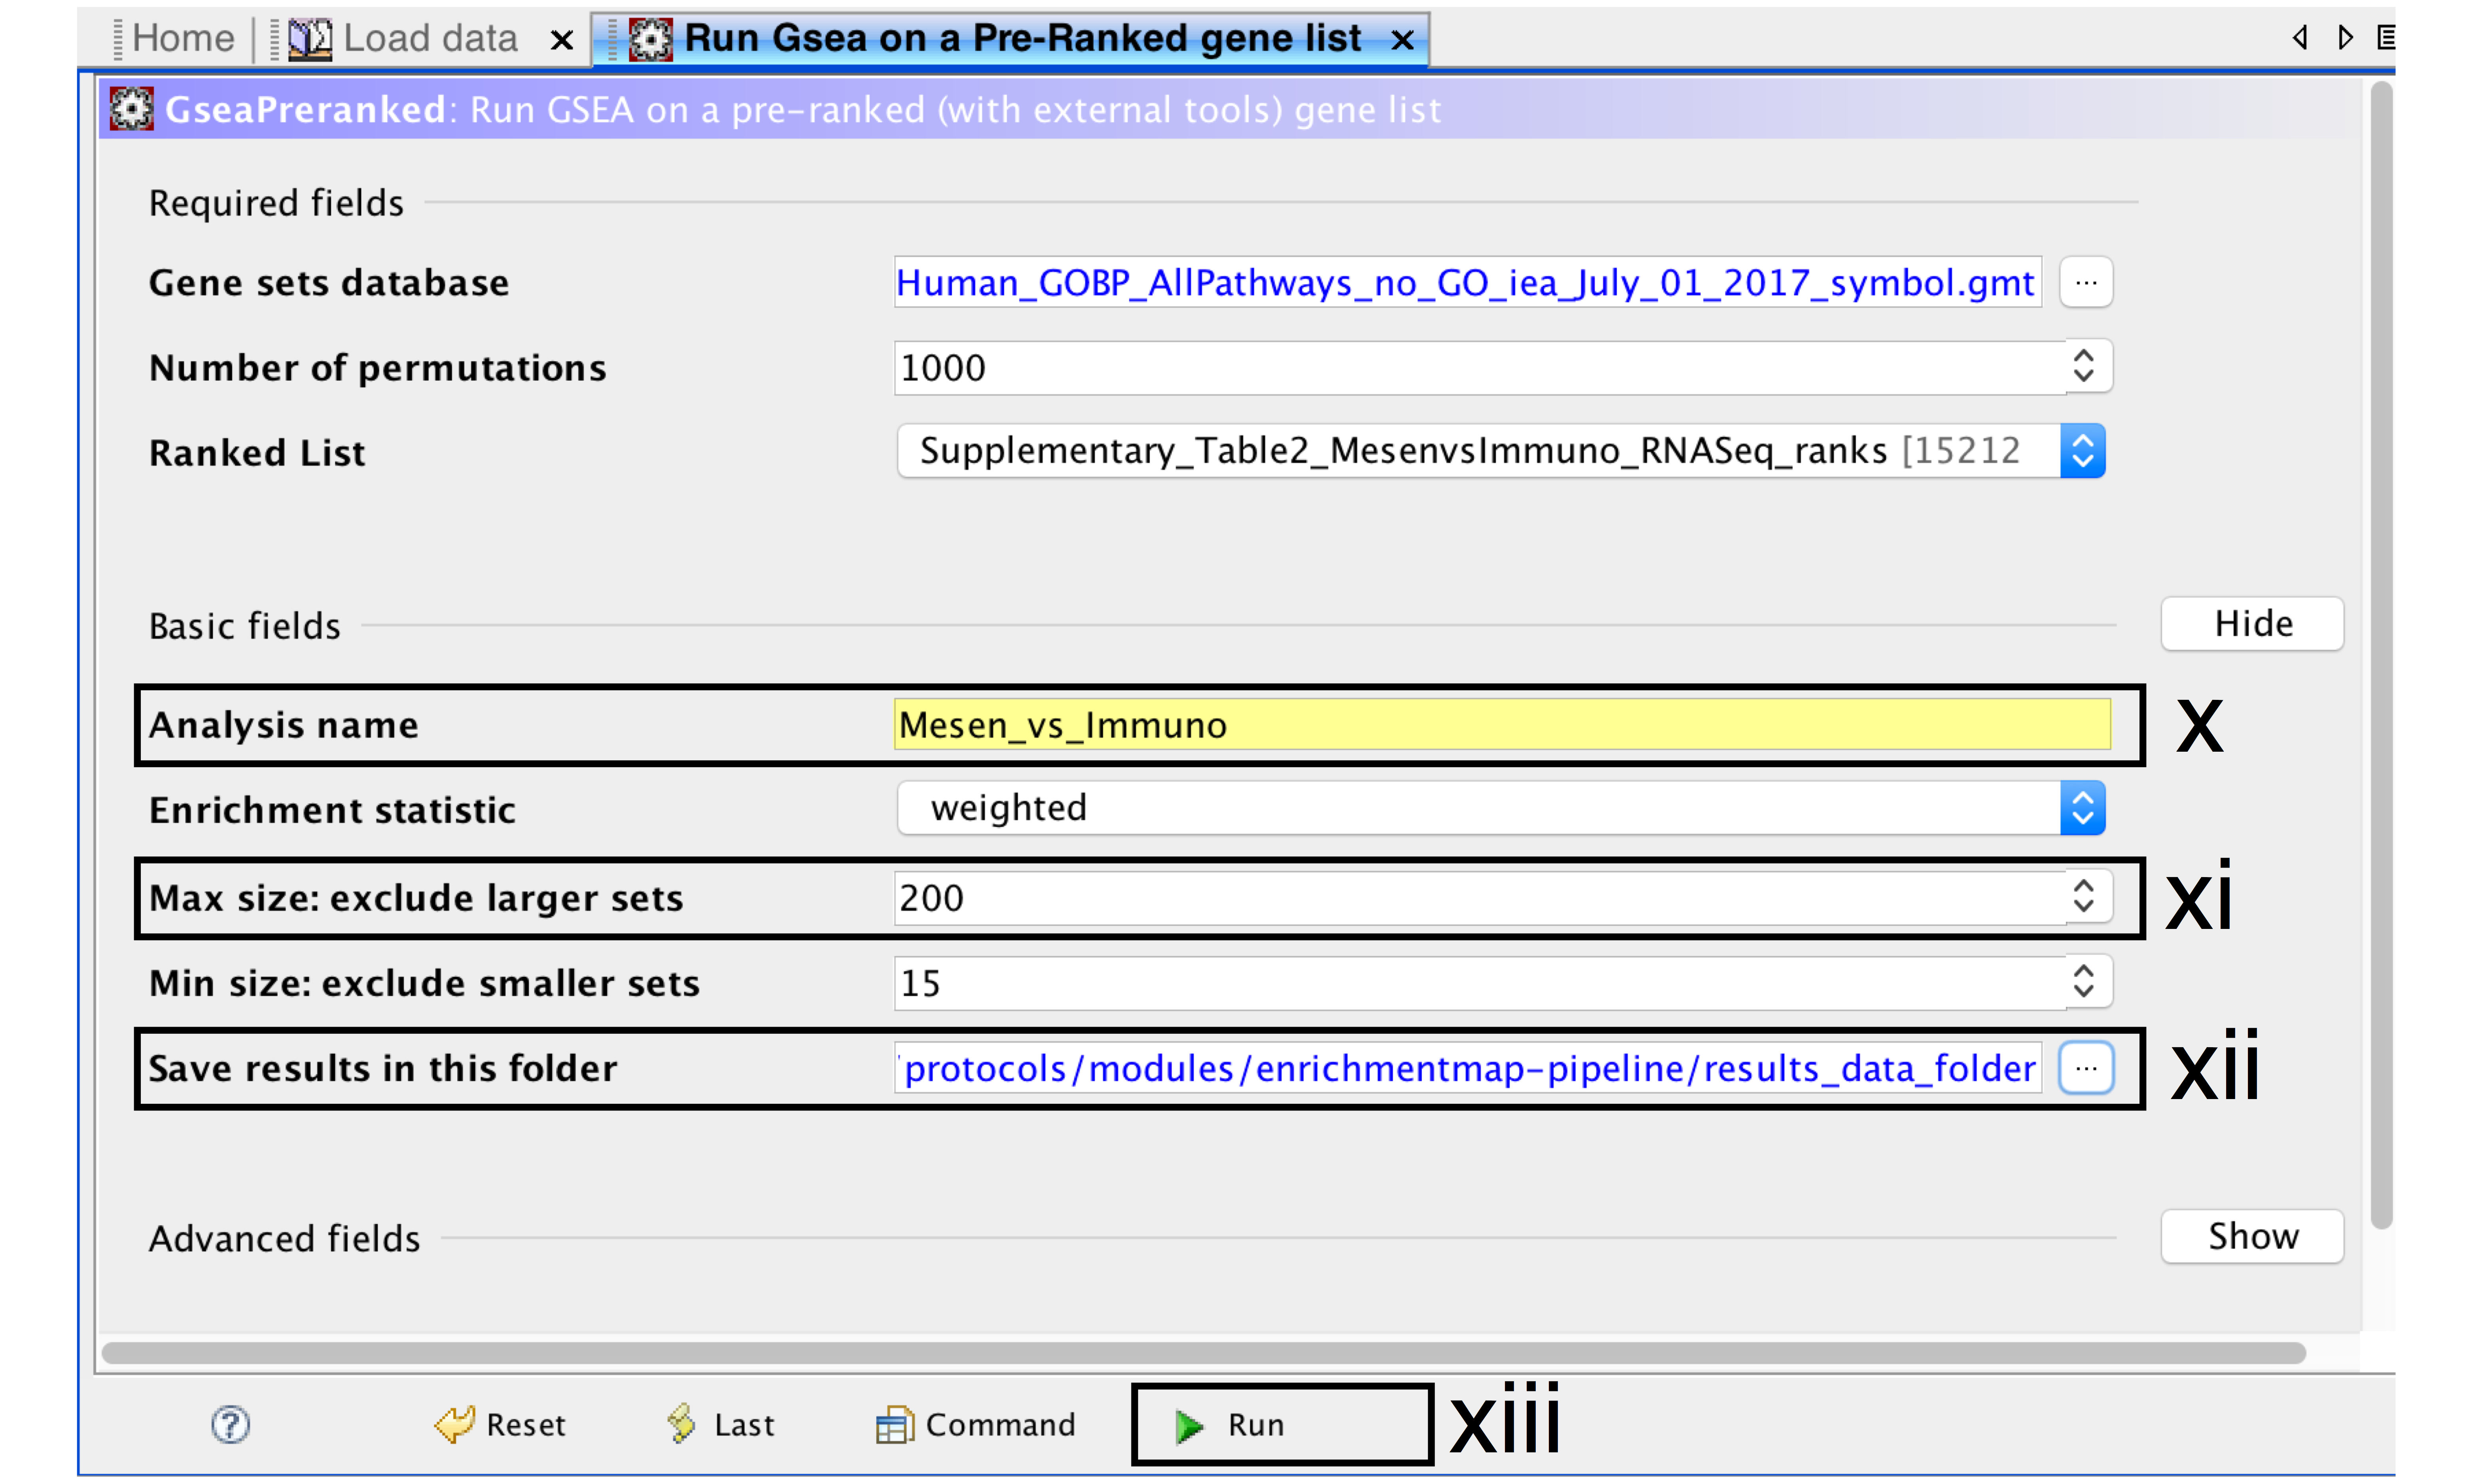
- Analysis name – change default “my_analysis” to a specific name, for example “Mesen_vs_Immuno”.
- Max size: exclude larger sets – By default GSEA sets the upper limit to 500. Set this to 200 to remove the larger sets from the analysis.
- Save results in this folder – navigate to the folder where GSEA should save the results. We recommend you choose the result data folder created in Step 1i. Otherwise, GSEA will use the default location gsea_home/output/[date] in your home directory.
6B. Pathway enrichment analysis of a ranked gene list using GSEA - cont'd
- Run GSEA – click on the Run button located at the bottom of the window.
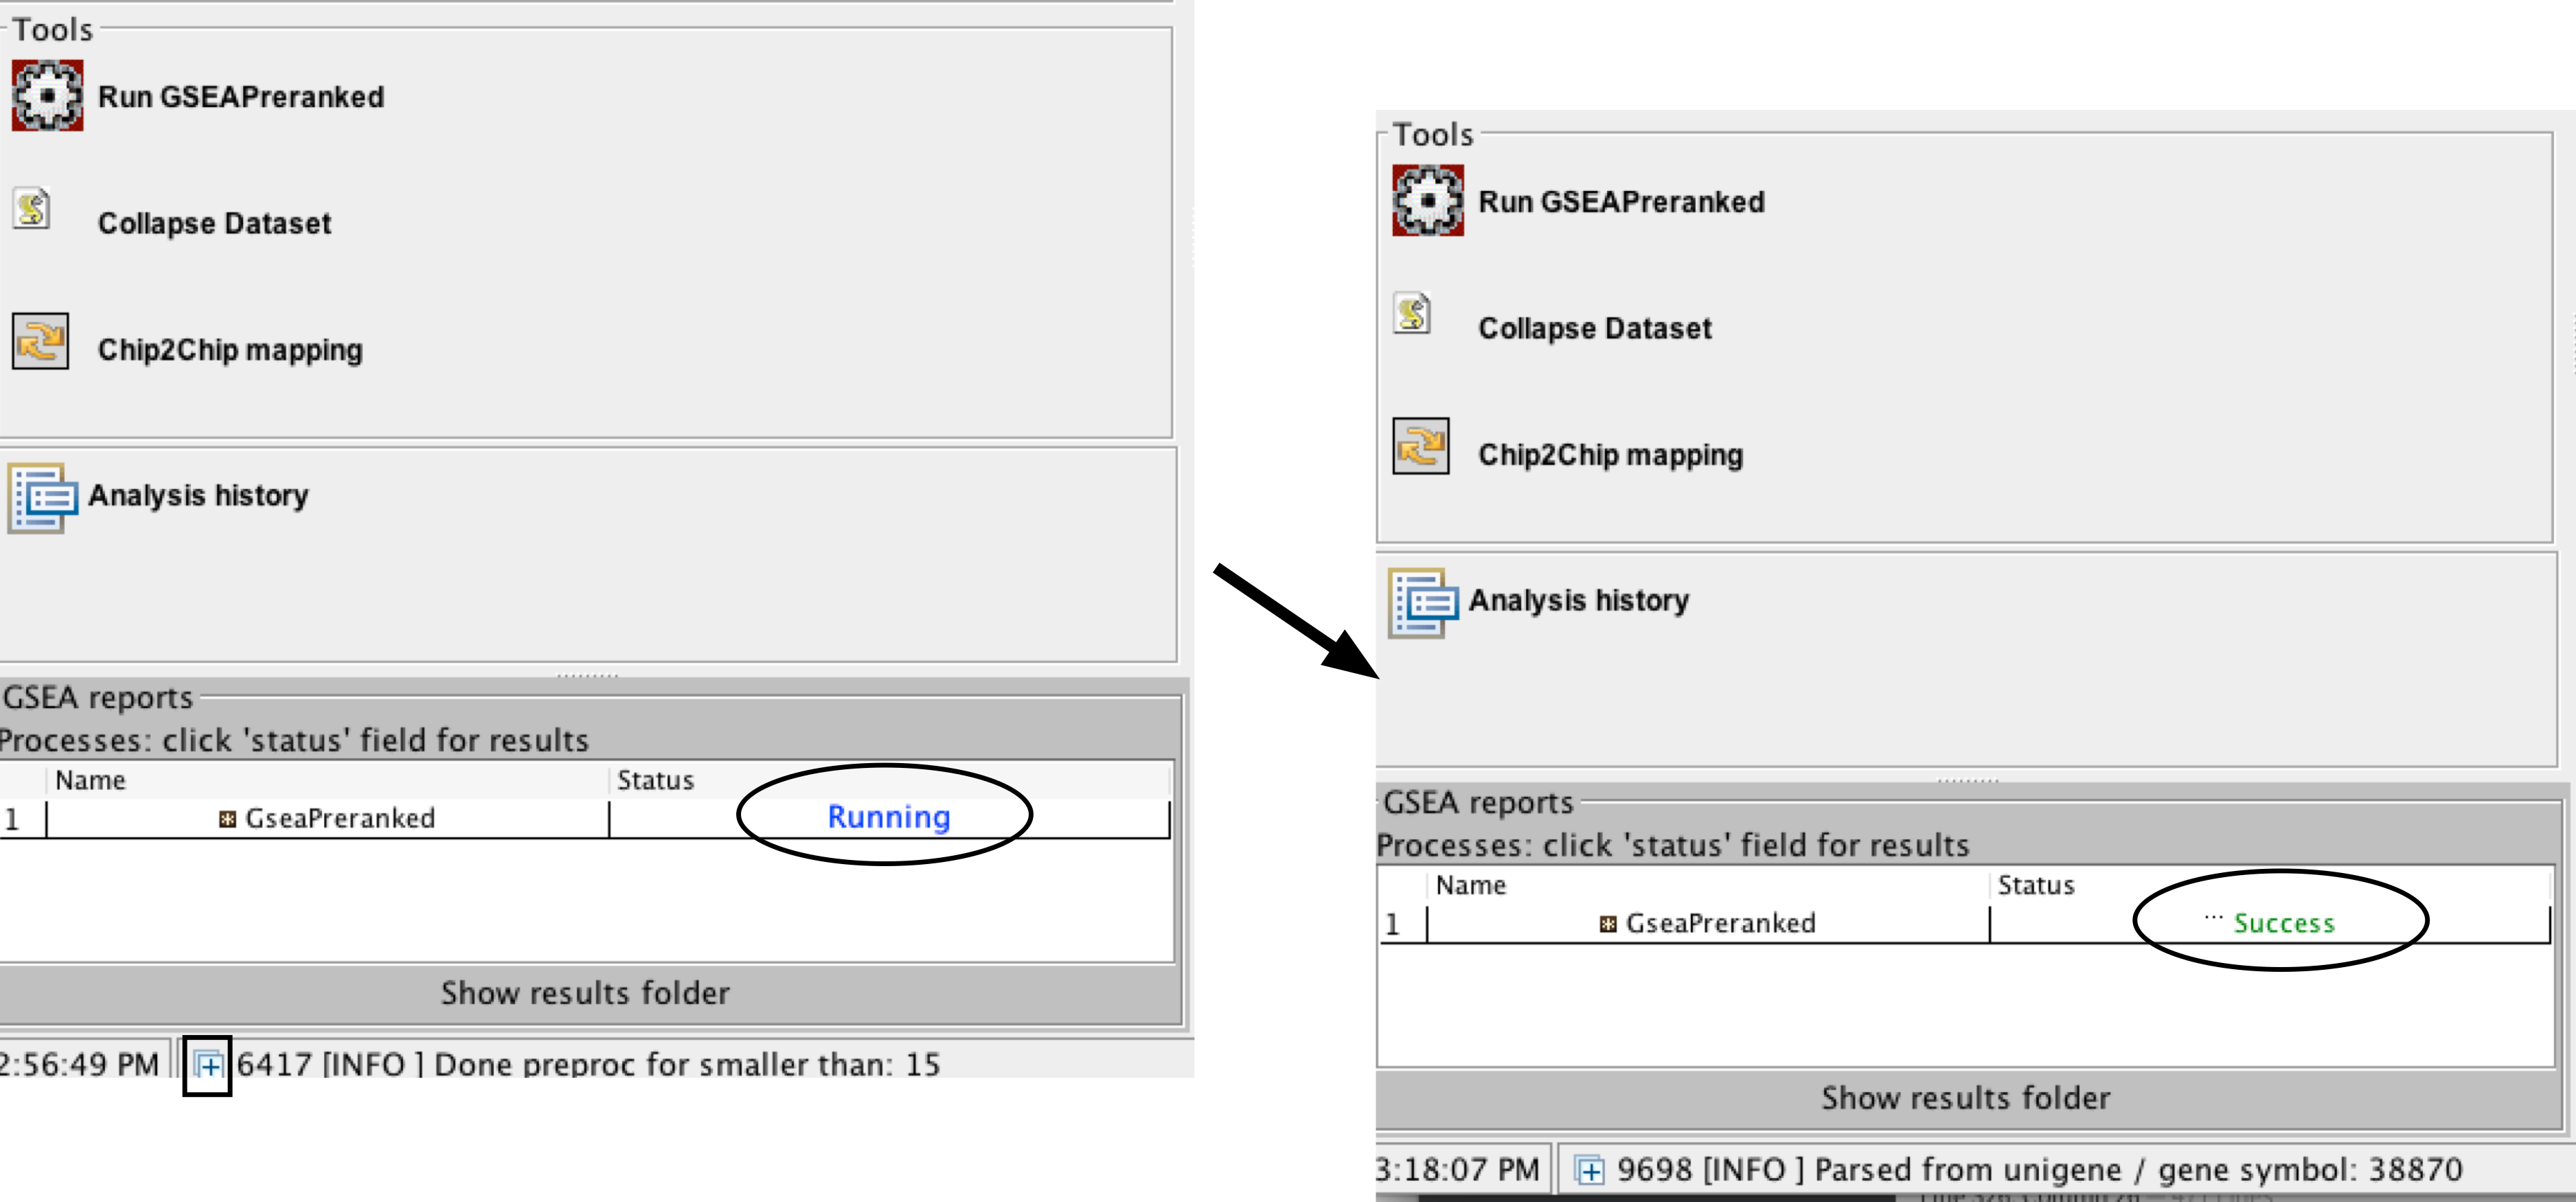
- The GSEA reports pane at the bottom left of the window will show the status “Running”.
- It will be updated to “Success” upon completion.
- This is expected to be a long running process, depending on the speed of your computer.
Troubleshooting - Running GSEA
- TROUBLESHOOTING: GSEA looks non-responsive but it is actually computing enrichments.
- Possible reason: No progress bar.
- GSEA has no progress bar to indicate estimated time to completion.
- A run can take a few minutes or hours depending on your data size and computer speed.
- Click on the “+” in the bottom left corner of the screen to see messages such as “shuffleGeneSet for GeneSet 4661/4715 nperm: 1000”
- This message indicates that GSEA is shuffling 4,715 gene sets 1,000 times each, 4,661 of which are complete. Once the permutations are complete, GSEA generates the report.
Troubleshooting - Running GSEA
- TROUBLESHOOTING: Error message "Java Heap space".
- Possible reason: GSEA was launched with insufficient memory.
- The error message “Java Heap space” indicates that the software has run out of memory.
- Another version of GSEA is needed if you are running the Web Start application. There are multiple options available for download from the GSEA website. You can download a webstart application that launches GSEA with 1, 2, 4, or 8GB. Upgrade to a webstart that launches with more memory.
- If you are already using the webstart that launches with 8GB then you require GSEA JAVA jar file which can be executed from the command line with increased memory .
6B. Pathway enrichment analysis of a ranked gene list using GSEA - cont'd
- Once the GSEA analysis is complete, a green notification “Success” will appear in the bottom left section of the screen.
- All GSEA output files will be automatically saved and available in the folder you specified in the GseaPreranked interface (Specified in Step 6Bxii).
- Click on “Success” to open the results in your web browser.
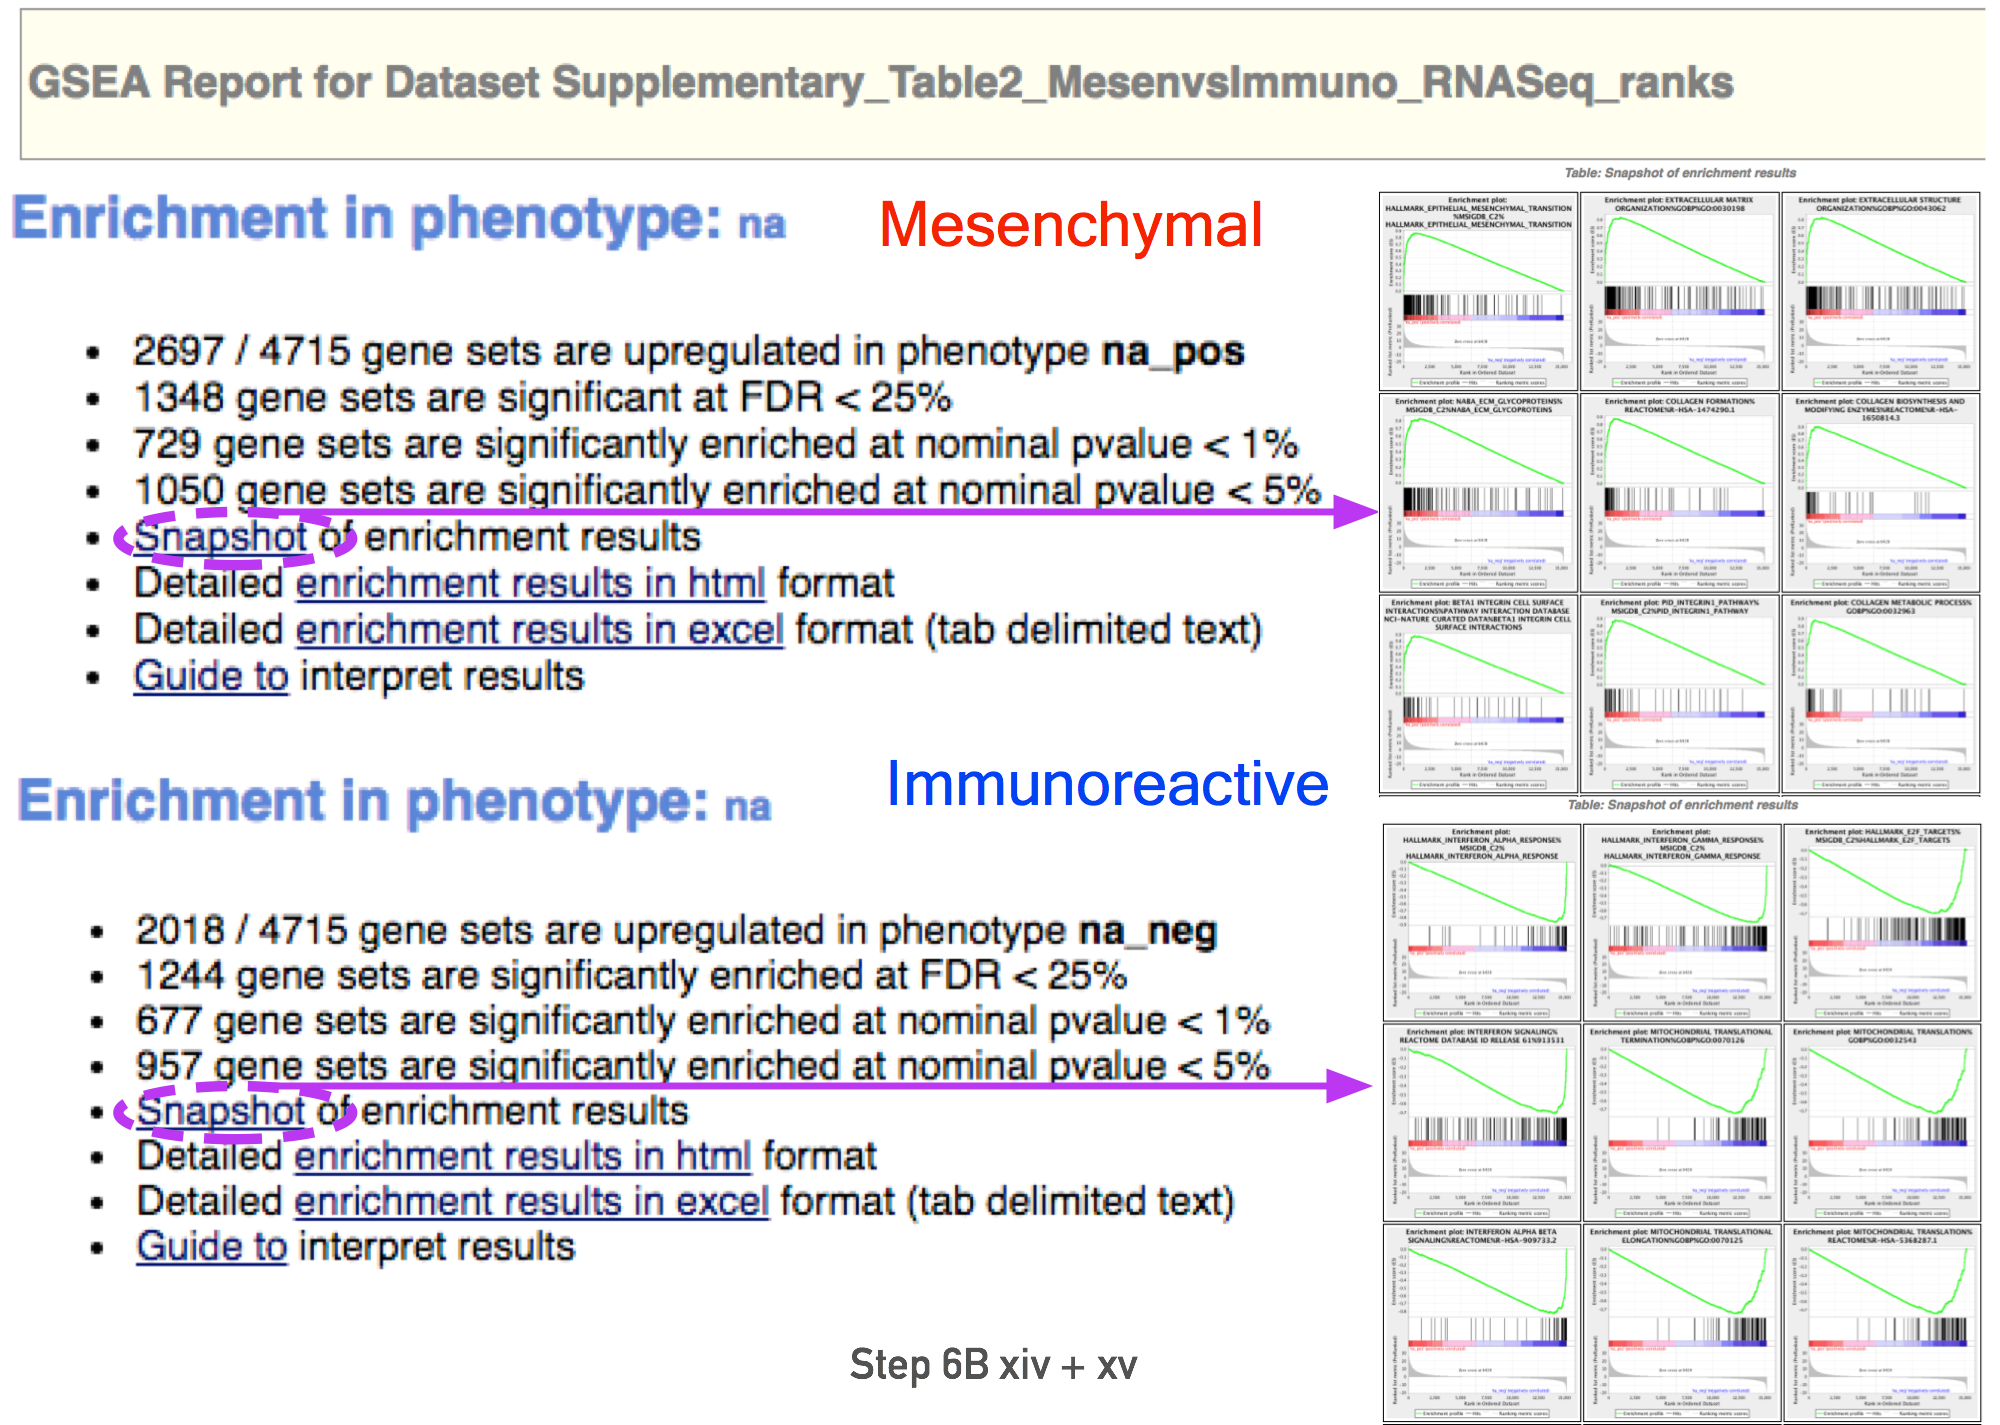
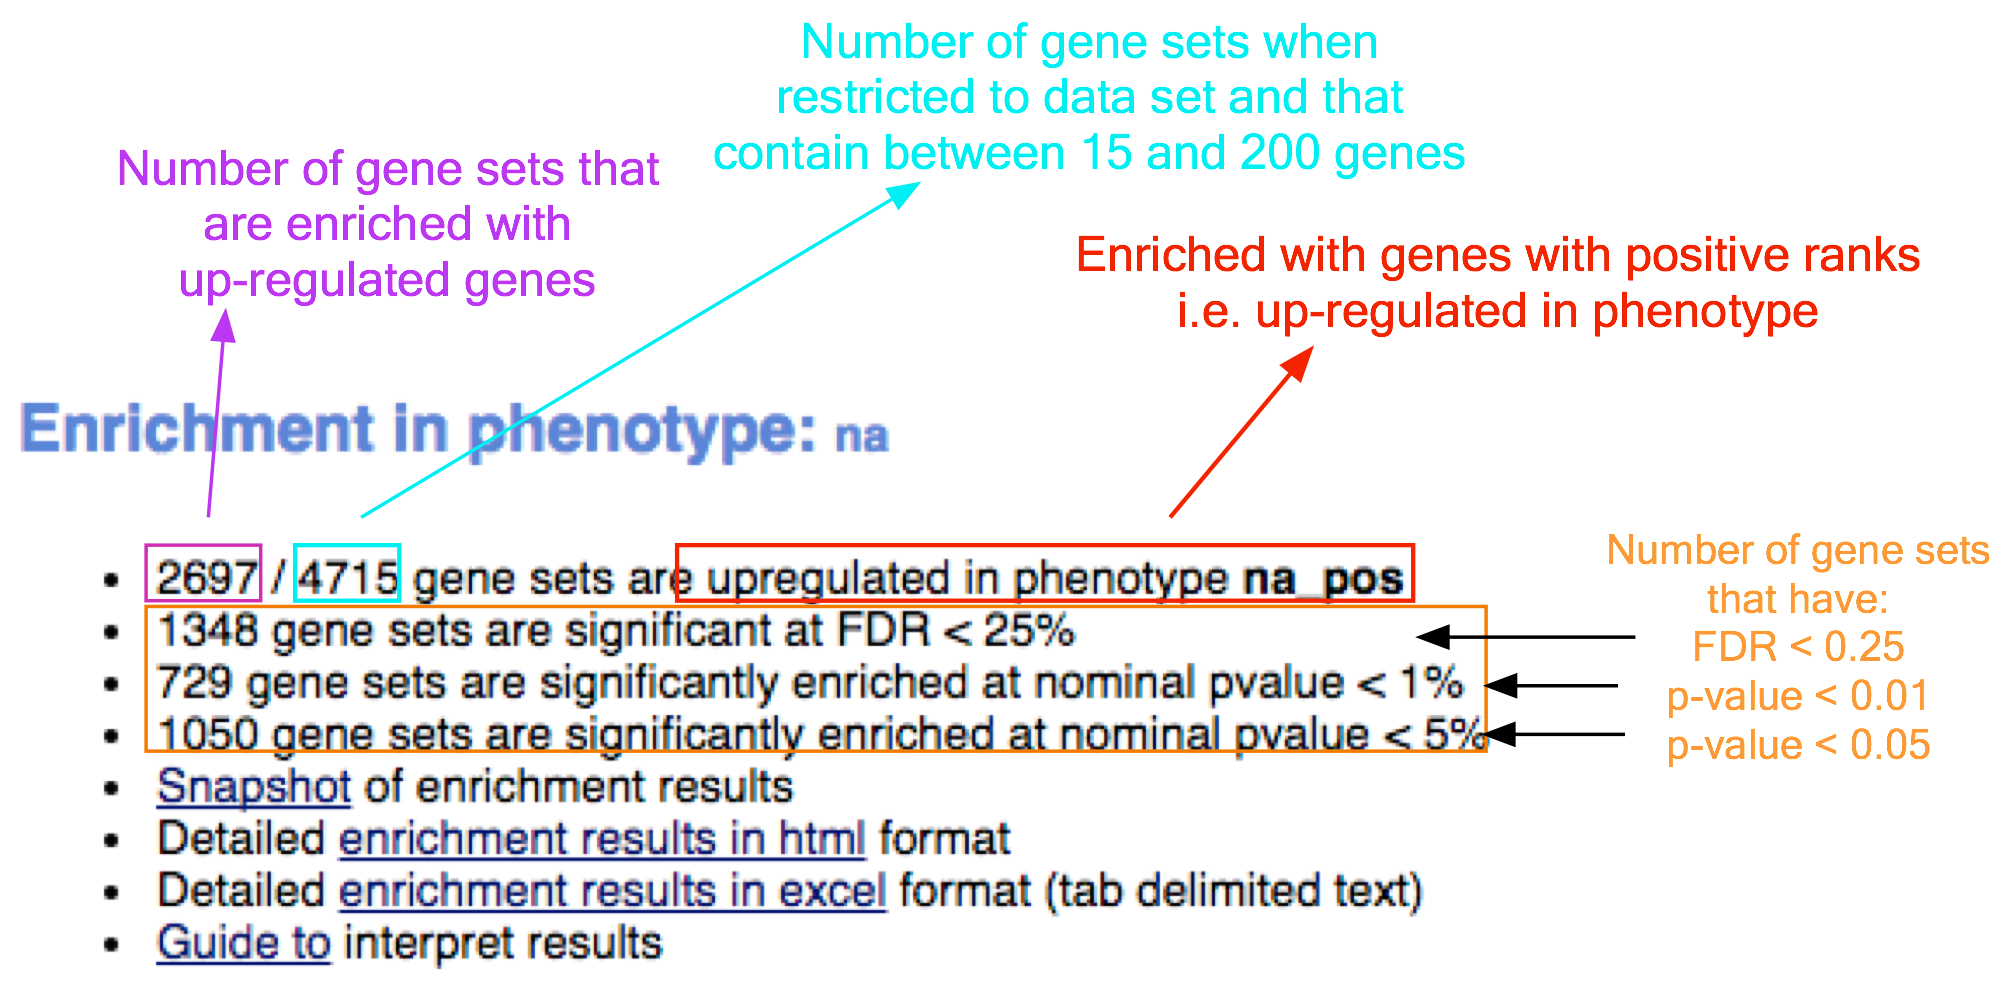
- Pathways enriched in top-ranking genes (i.e. up-regulated) are shown in the first set (‘na_pos’; ‘mesenchymal’ in this protocol)
- Pathways enriched in bottom-ranked genes (i.e. down-regulated) in the second set (‘na_neg’; ‘immunoreactive’)
6B. Pathway enrichment analysis of a ranked gene list using GSEA - cont'd
- In the web browser results summary, click on the “Snapshot” link under the results to get an overview of the top 20 findings.
- The most significant pathways for the first phenotype (‘na_pos’) should clearly display enrichment in top-ranking (i.e. up-regulated) genes (left side of the plot.
- the most significant pathways for the second phenotype (‘na_neg’) should clearly display enrichment in bottom-ranked (i.e. down-regulated) genes (right side of the plot)
Troubleshooting - Examining GSEA Results
- TROUBLESHOOTING: How to access previous results.
- Possible reason: GSEA application was closed since running the analysis but you would like to see previous results.
- If the GSEA software is closed, you can access previous results by opening the working folder and opening the ‘index.html’ file.
- Alternatively, you can re-launch GSEA and click on “Analysis history”, then “History” and then navigate to date of your analysis.
- Although all analyses, regardless of where the results files were saved, are listed under history, it is organized by date the analysis was run. If you cannot remember when you ran a specific analysis, then you may have to manually search through a few directories to find the desired analysis.
Troubleshooting - Examining GSEA Results
- TROUBLESHOOTING: What will GSEA use for phenotype labels in a CLS file that specifies more than two phenotypes?
- When running GSEA with expression data as input (instead of a pre-calculated rank file), a phenotype label (i.e. biological condition or sample class) is provided as input for each sample and specified in the GSEA ‘cls’ file.
- When running GSEA, the two phenotypes to compare for differential gene expression analysis are specified and these phenotypes are used in the pathway enrichment result files.
- In contrast, in a GSEA preranked analysis (i.e. when a ranked gene list is provided by the user), GSEA automatically labels one phenotype “na_pos” (corresponding to enrichment in the genes at the top of the ranked list, where ‘na’ means the phenotype label is "not available") and the other “na_neg” (corresponding to enrichment in the genes at the bottom of the ranked list). This convention is also used by the EnrichmentMap software, designating the first phenotype as “positive” and the second phenotype as “negative”.
6B. Pathway enrichment analysis of a ranked gene list using GSEA - cont'd
- In the web browser results summary, click on ‘Detailed enrichment results in HTML format’.
- Use the row numbering to check the number of pathways that have FDR q-values below 0.05 to determine appropriate thresholds for EnrichmentMap in the next step of the protocol.
-
- If no pathways are reported at q< 0.05, more lenient thresholds such as q<0.1 or q<0.25 could be used
- The threshold q<0.25 provides very lenient filtering and it is not uncommon to find thousands of enriched pathways at this level. Robust analyses should use a cutoff of q< 0.05 or lower.
- Filtering only by uncorrected p-values is not recommended.
Troubleshooting - Examining GSEA Results
- TROUBLESHOOTING: Few or no results returned by GSEA
- Possible reason: Possible identifier mapping issue.
- Check the number of gene sets that were analyzed. If the number is low (e.g. low hundreds), it could indicate gene ID mapping problems.
Visualize enrichment results with EnrichmentMap
-
- Launch the Cytoscape software. Introductory Cytoscape tutorials can be found at http://tutorials.cytoscape.org.
-
- In the menu, click Apps --> EnrichmentMap.
-
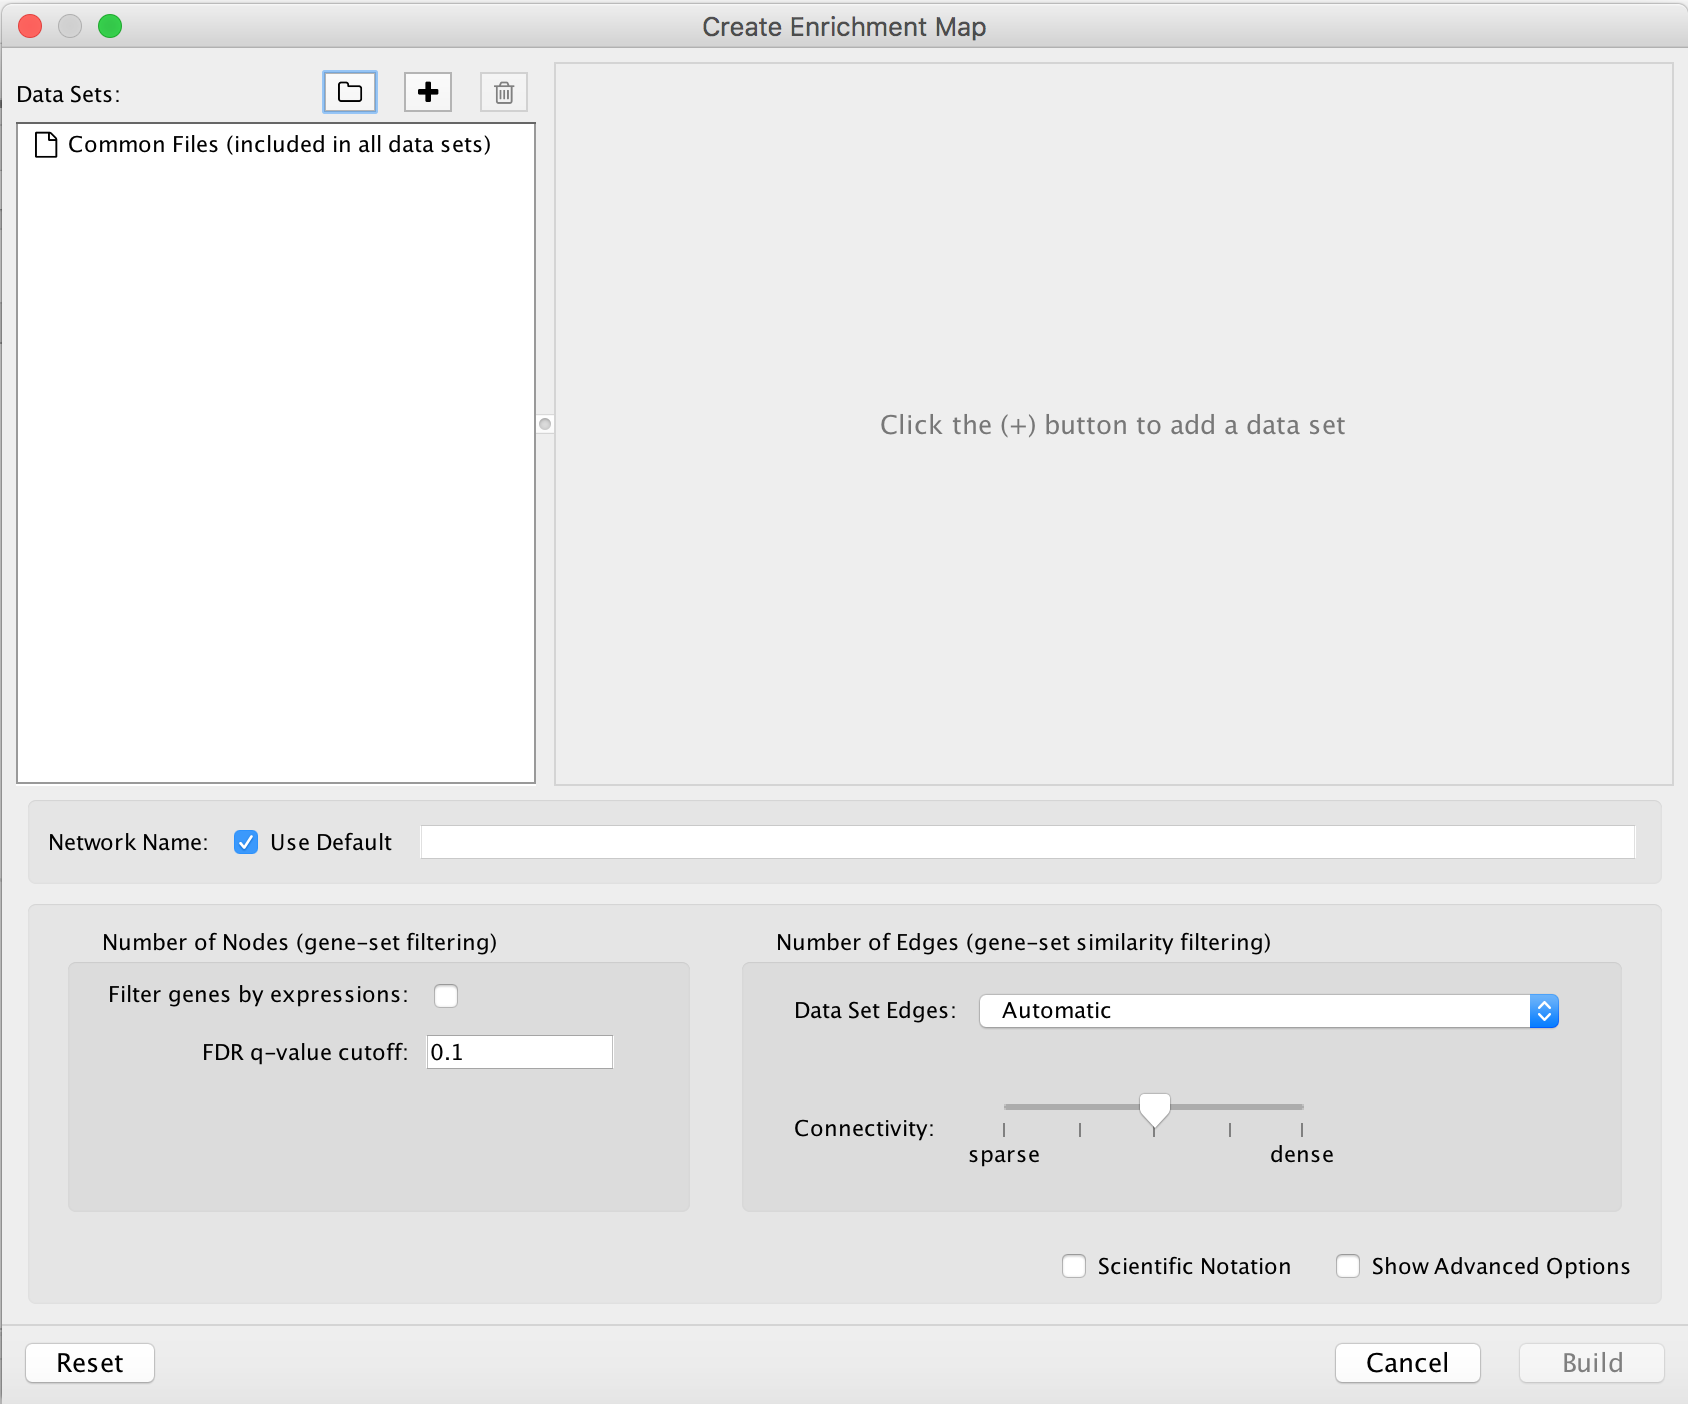
- Create Enrichment Map panel will appear. Creating enrichment maps with g:Profiler (follow steps in 9A) and GSEA (follow steps in 9B) requires different input files.
9A. Visualize enrichment results with EnrichmentMap use g:Profiler results
-
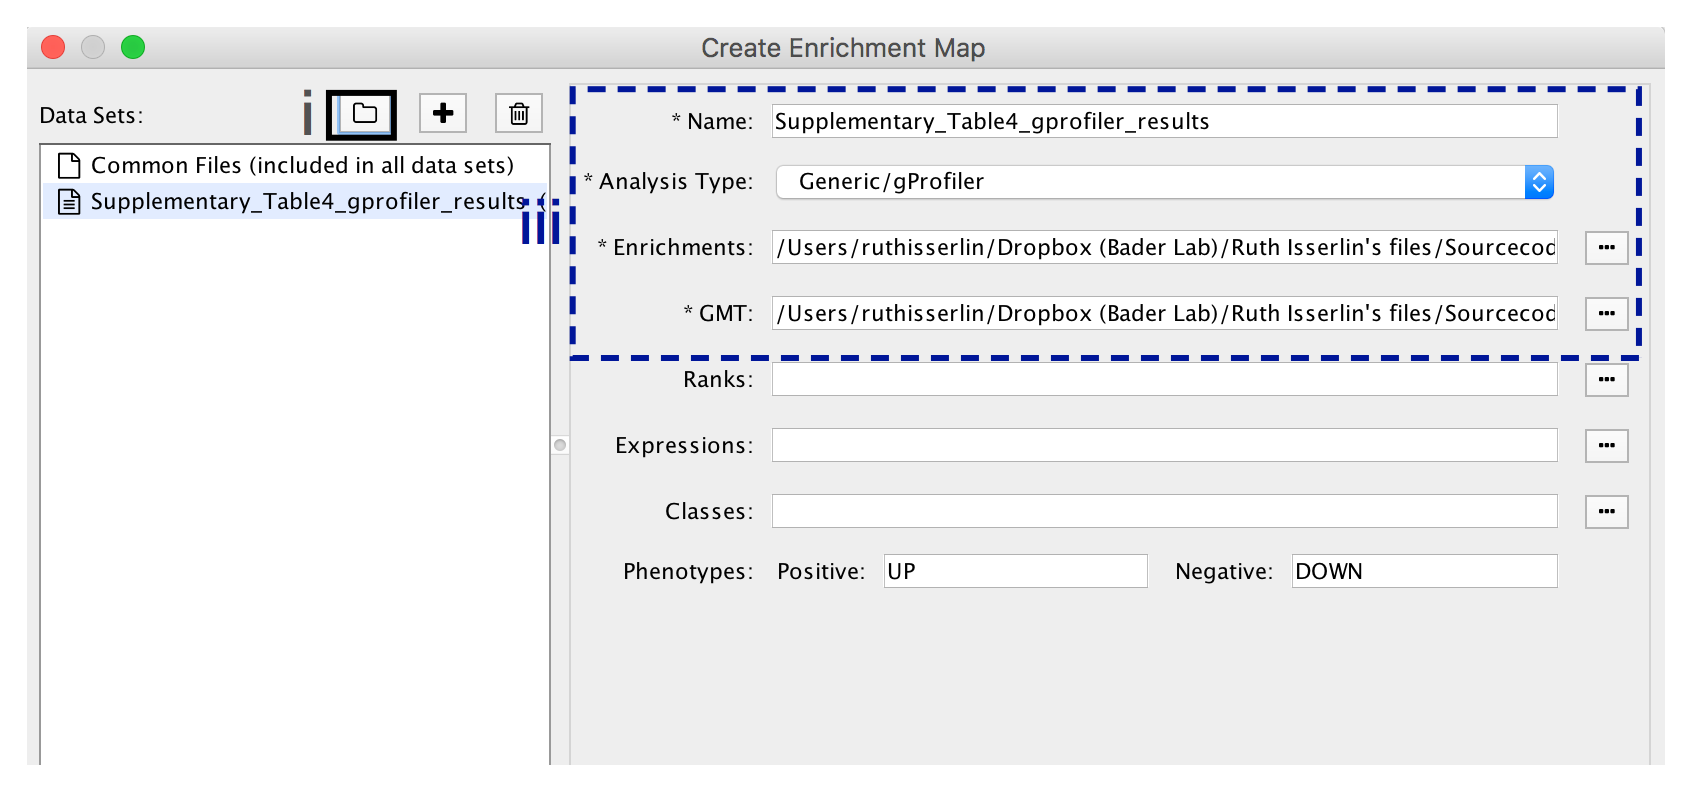
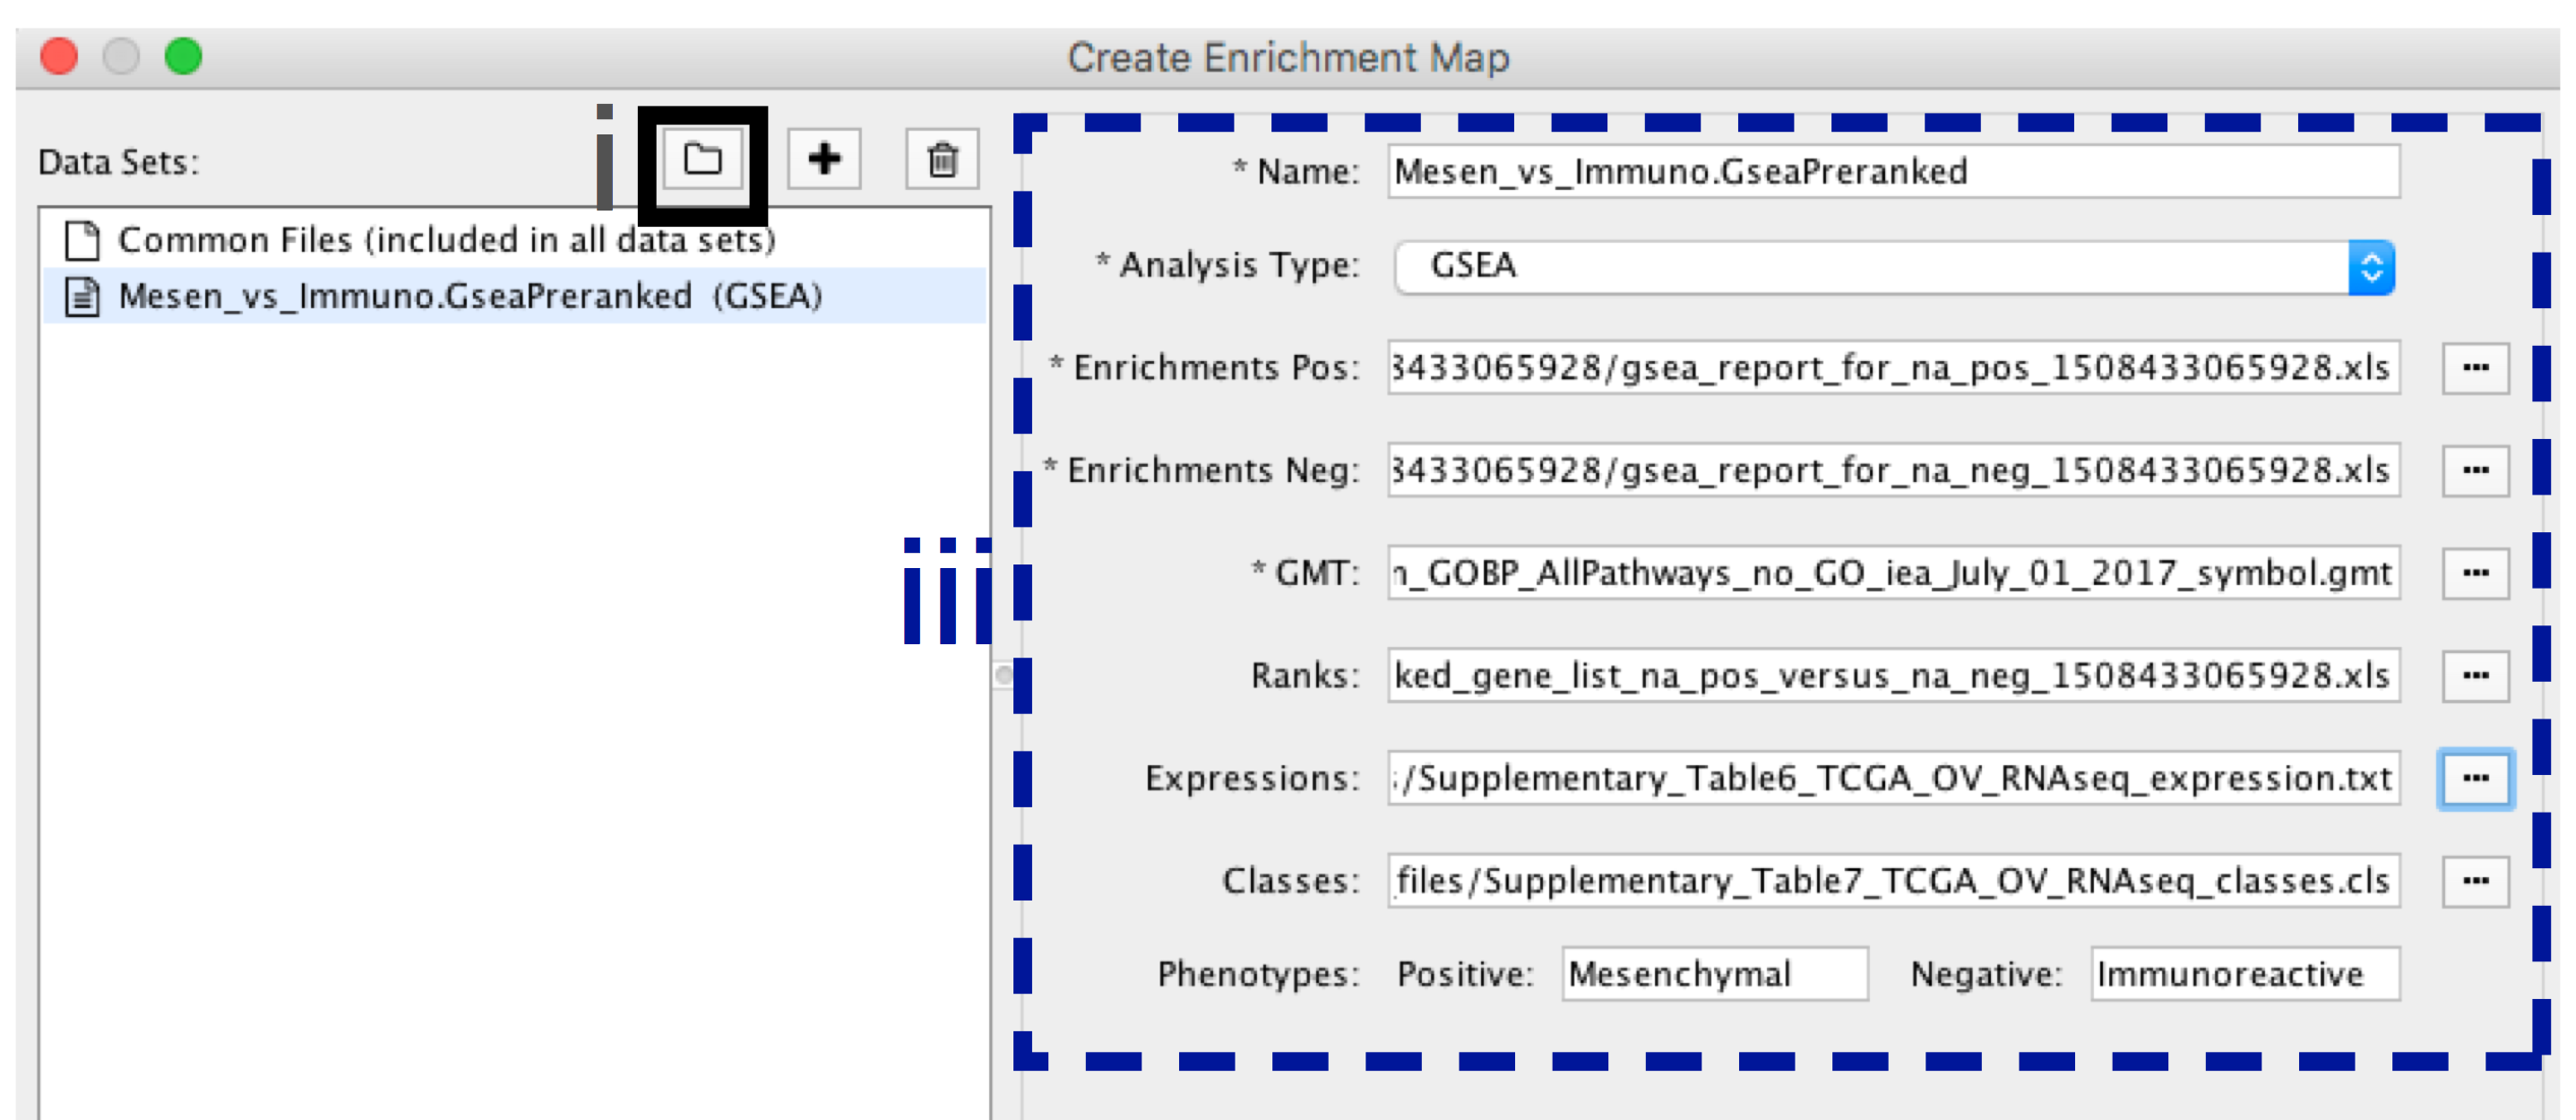
- In the Create Enrichment Map panel, click on folder icon.
-
- Locate and select your result data folder containing the g:Profiler results and click on Open.
-
- In the right-hand pane g:Profiler output files will be automatically populated into their specified fields. Alternatively, users can click on the + symbol to specify each of the required files manually.
Troubleshooting - Visualizing g:Profiler Results
- TROUBLESHOOTING: Autoload of g:Profiler results creates many datasets with incorrect file specification.
- Possible reason: There are too many text files within the directory specified.
- To simplify loading g:Profiler results into EnrichmentMap and populating the correct fields in the EnrichmentMap interface, place the g:Profiler results file and gene set file (i.e. Supplementary_Table4_gprofiler_results.txt and Supplementary_Table5_hsapiens.pathways.NAME.gmt) into a directory together by themselves.
9A. Visualize enrichment results with EnrichmentMap use g:Profiler results - cont'd
-
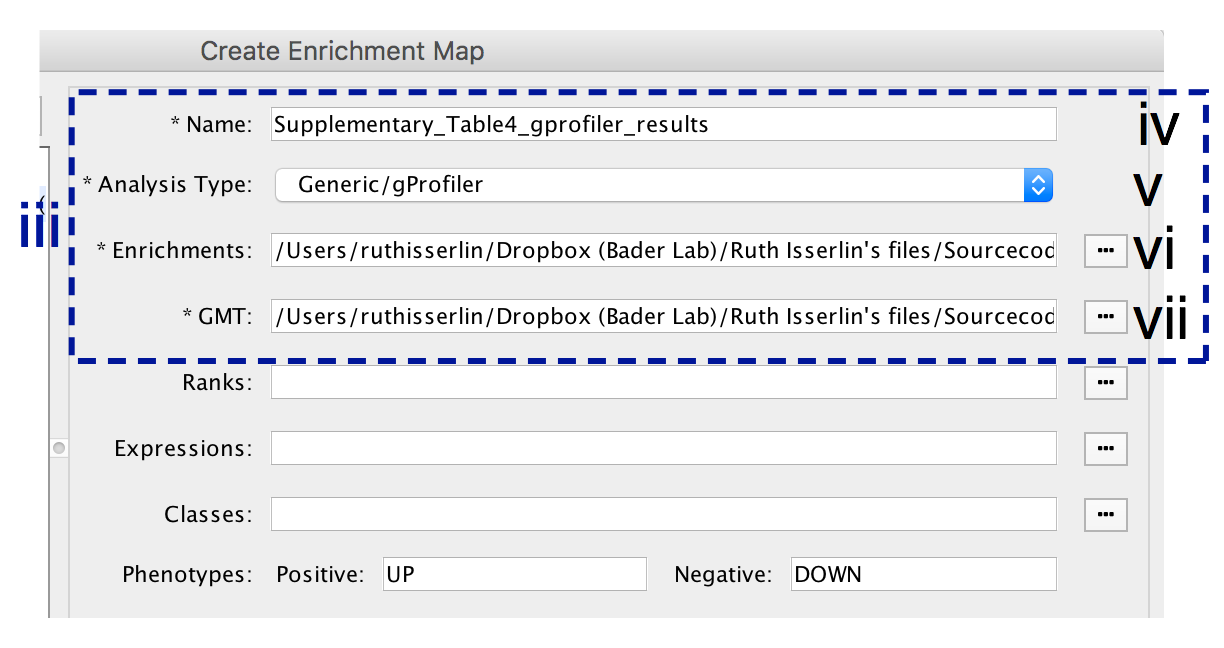
- In the right-hand pane, modify Name of the created data set if desired. By default, EnrichmentMap will use the name of the g:Profiler enrichment results file (e.g. Supplementary_Table4_gprofiler_results.txt).
-
- Verify the Analysis Type is set to “Generic/gProfiler”.
-
- Verify the Enrichments results file is the g:Profiler file downloaded in Step 6Axi (or alternatively, manually specify Supplementary_Table4_gprofiler_results.txt).
-
- Verify the GMT specified is the file retrieved from the g:Profiler website in Step 6Axii . Use the file hsapiens.pathways.NAME.gmt (or alternately manually specify Supplementary_Table5_hsapiens.pathways.NAME.gmt) that contains gene sets corresponding to GO biological processes and Reactome pathways.
9A. Visualize enrichment results with EnrichmentMap use g:Profiler results - cont'd
-
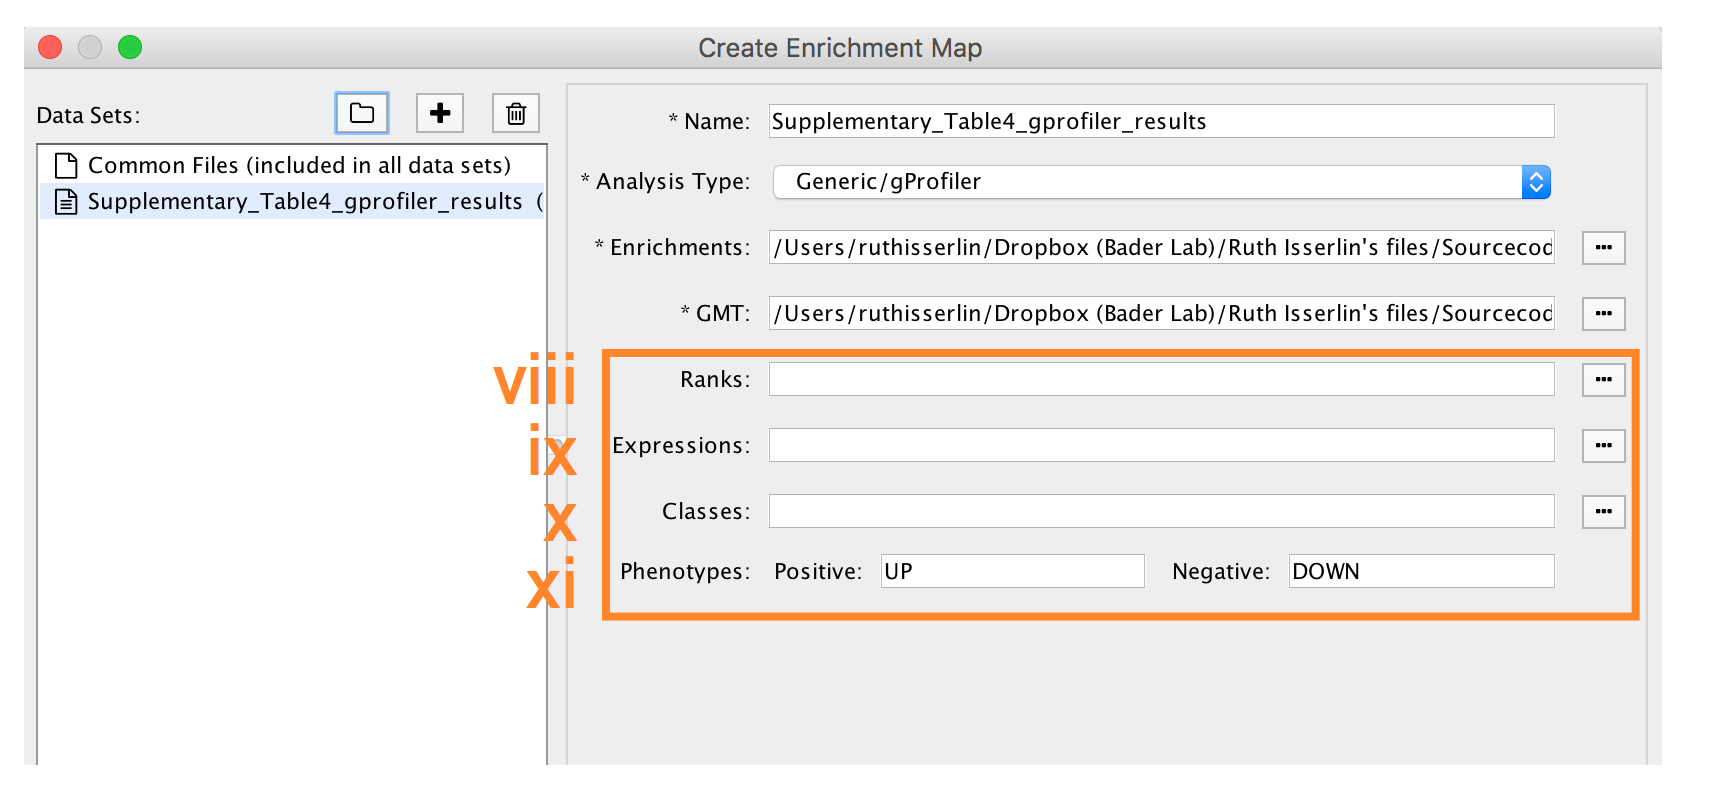
- Expressions - (Optional) Upload an expression matrix for the genes analyzed in g:Profiler or alternatively an expression data set of all genes. If the expression data set contains additional genes not used for the g:Profiler search, their expression values will still appear in the heat map of the enrichment map (for example file see Supplementary_Table6_TCGA_OV_RNAseq_expression.txt).
-
- Ranks – (Optional) Ranks for the gene list or the expression data can be specified (for example, see Supplementary_Table2_MesenvsImmuno_RNASeq_ranks.rnk).
-
- Classes – (Optional) GSEA CLS file defining the phenotype (i.e. biological conditions) of each sample in the expression file, for example, see Supplementary_Table7_TCGA_OV_RNAseq_classes.cls. ).
-
- Phenotypes – (Optional) If there are two different phenotypes in the expression data, update the phenotype labels so that ‘positive’ represents the phenotype associated with positive values (Mesenchymal in this example) and ‘negative’ with negative values (Immunoreactive in this example).
Troubleshooting - Visualizing g:Profiler Results
- TROUBLESHOOTING: How to create g:Profiler map with more than one phenotype.
- Although an individual g:Profiler analysis only has one phenotype, it is possible to modify a single results file to contain two analyses.
- This is relevant when the phenotypes are mutually exclusive.
- For the analysis you want to associate with the additional phenotype (which would correspond to down-regulated genes in GSEA PreRanked, thus called “negative”) open the g:Profiler results file (preferably in a spreadsheet so you can easily modify a single column).
- The fifth column specifies the phenotype. Update the column to have the value of “-1” for each result in the file.
- Open the second analysis file. Copy all the results from the second file and paste them into the updated negative g:Profiler file.
- Save the file and use it as the g:Profiler enrichment results file in the EnrichmentMap interface instead of the original results files.
- Pathways corresponding to two phenotypes will be colored red and blue in the resulting enrichment map. One limitation with this approach is that a pathway cannot be included in both positive and negative sets.
9A. Visualize enrichment results with EnrichmentMap use g:Profiler results - cont'd
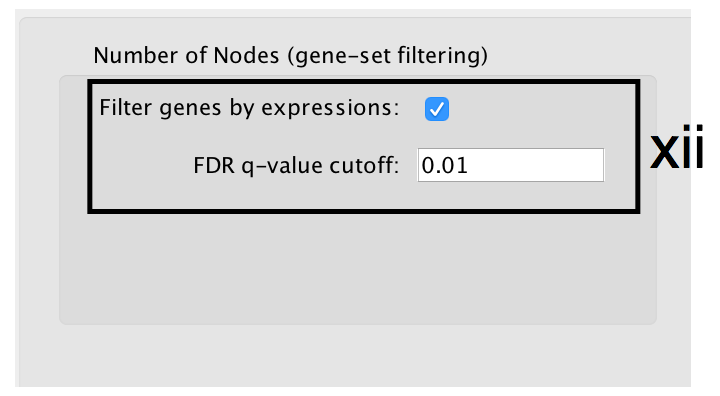
- Number of Nodes: -
- g:Profiler returns only statistically significant results (q < 0.05) by default, so the FDR q-value cutoff parameter can be set to 1 in the EnrichmentMap Input panel unless a more stringent filtering is desired. For this protocol, set FDR q-value to 0.01.
- Select Filter genes by expressions to exclude any genes in the gene set definition file (i.e. the gmt file) that are not found in the supplied expression file.
- If Filter genes by expressions is not selected, any gene that is not found in the expression file will be retained and will be presented in the expression heat map viewer with all of its associated expression values grayed out.
9A. Visualize enrichment results with EnrichmentMap use g:Profiler results - cont'd
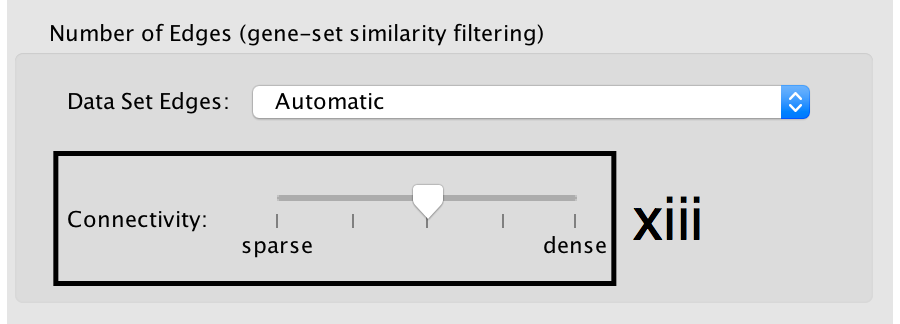
- Number of Edges: -
- Keep the connectivity slider in the centre.
- If the network is too cluttered because of too many connections (edges), move the slider to the left to make the network sparser.
- Alternatively, if the network is too sparse (i.e. there are too many disconnected pathways), move the slider to the right to obtain a more densely connected network.
Troubleshooting - Visualizing g:Profiler Results
- TROUBLESHOOTING: What happens when you move the similarity slider bar?
- Moving the slider to the left (or right) will adjust the underlying similarity statistic threshold to make the resulting network sparser (or denser).
- The slider is set with predefined defaults but users can fine-tune the similarity metric by selecting "Show advanced options" at the bottom of the "Create Enrichment Map" panel.
- Predefined values appear as tick marks on the slider and include Jaccard > 0.35, Jaccard > 0.25, combined > 0.375, overlap > 0.5, overlap > 0.25.
9A. Visualize enrichment results with EnrichmentMap use g:Profiler results - cont'd

- Click the Build button at the bottom of the EnrichmentMap Input panel. A Building EnrichmentMap box appears and indicates the progress status. This box will disappear once the map has been created successfully.
9B. Visualize enrichment results with EnrichmentMap use GSEA results
-
- In the Create Enrichment Map panel, click on folder icon.
-
- Locate and select your result data folder containing the GSEA results and click on Open.
-
- In the right-hand pane, GSEA output files will be auto populated into their specified fields. Alternately the + symbol can be clicked to specify each of the required files manually.
Troubleshooting - Visualizing GSEA Results
- TROUBLESHOOTING: How to easily create GSEA map with more than one dataset.
- If you specify a directory that contains multiple GSEA results rather than an individual GSEA results folder, EnrichmentMap will treat every GSEA results folder as its own data set. This enables easy multi-data set analyses. If you only want one data set but inadvertently selected the directory containing multiple GSEA results instead of selecting an individual folder, simply select the data sets you do not want to use and click on the trash can at the top of the EnrichmentMap input panel to remove them.
9B. Visualize enrichment results with EnrichmentMap use GSEA results - cont'd
-
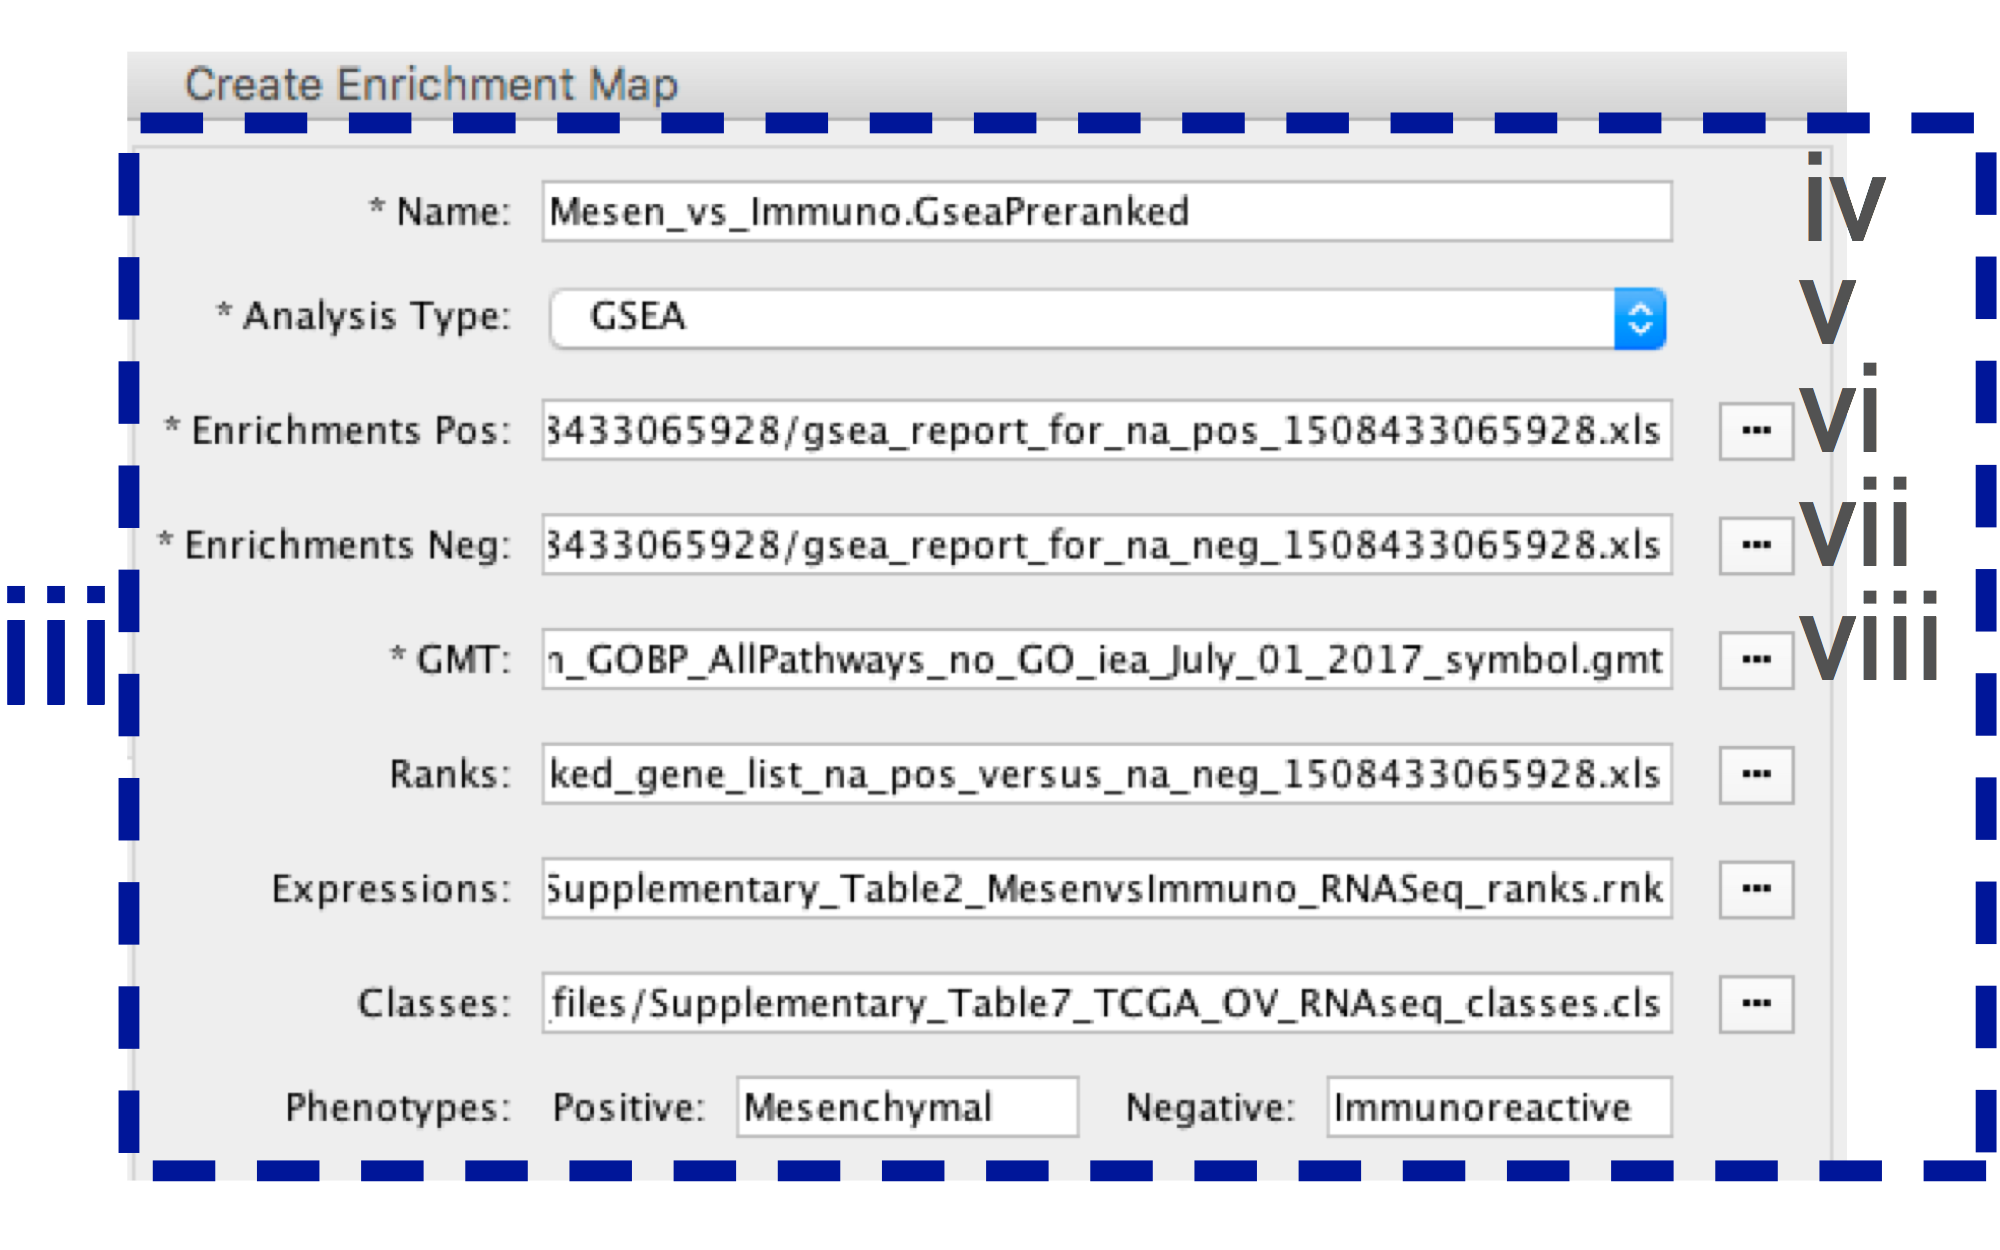
- In the right-hand pane, modify Name of the created data set if desired. By default, EM will use the first part of the GSEA folder name prior to the last dot ‘.’ to create the data set name. For example, if the directory is called Mesen_vs_Immuno.GseaPreranked.12345, the name will be populated as Mesen_vs_Immuno.GseaPreranked.
-
- Verify the Analysis Type is set to “GSEA”.
-
- Enrichment Pos - Verify that file is set to [your_path_to_gsea_dir]/Mesen_vs_Immuno.GseaPreranked.12345/gsea_report_for_na_pos_12345.xls where 12345 is a unique number generated by GSEA. Alternately navigate to the file Supplementary_Table8_gsea_report_for_na_pos.xls.
-
- Enrichment Neg - Verify that file is set to [your_path_to_gsea_dir]/Mesen_vs_Immuno.GseaPreranked.12345/gsea_report_for_na_neg_12345.xls where 12345 is a unique number generated by GSEA. Alternately navigate to the file Supplementary_Table9_gsea_report_for_na_neg.xls.
-
- Verify the GMT Verify that the file is set to Supplementary_Table3_Human_GOBP_AllPathways_no_GO_iea_July_01_2017_symbol.gmt.
Troubleshooting - Visualizing GSEA Results
- TROUBLESHOOTING: What is the random number appended to the GSEA directory name?
- Every GSEA analysis generates a random number that is appended to the names of the files and directories. The number will be different for every new analysis.
- TROUBLESHOOTING: Enrichment map uses a GMT file that was not the original file input to GSEA.
- If EnrichmentMap cannot find the original GMT file used in the GSEA analysis, it will use a filtered GMT file found in the GSEA ‘edb’ results directory. EnrichmentMap will not be able to find your original GMT file if you have moved it since running GSEA analysis. Although it is a GMT file, it has been filtered to contain only genes found in the expression file. If you use this filtered file, you will get different pathway connectivity depending on the expression data being used. You should always use the original GMT file used for the GSEA analysis and not the filtered one in the results directory.
9B. Visualize enrichment results with EnrichmentMap use GSEA results - cont'd
-
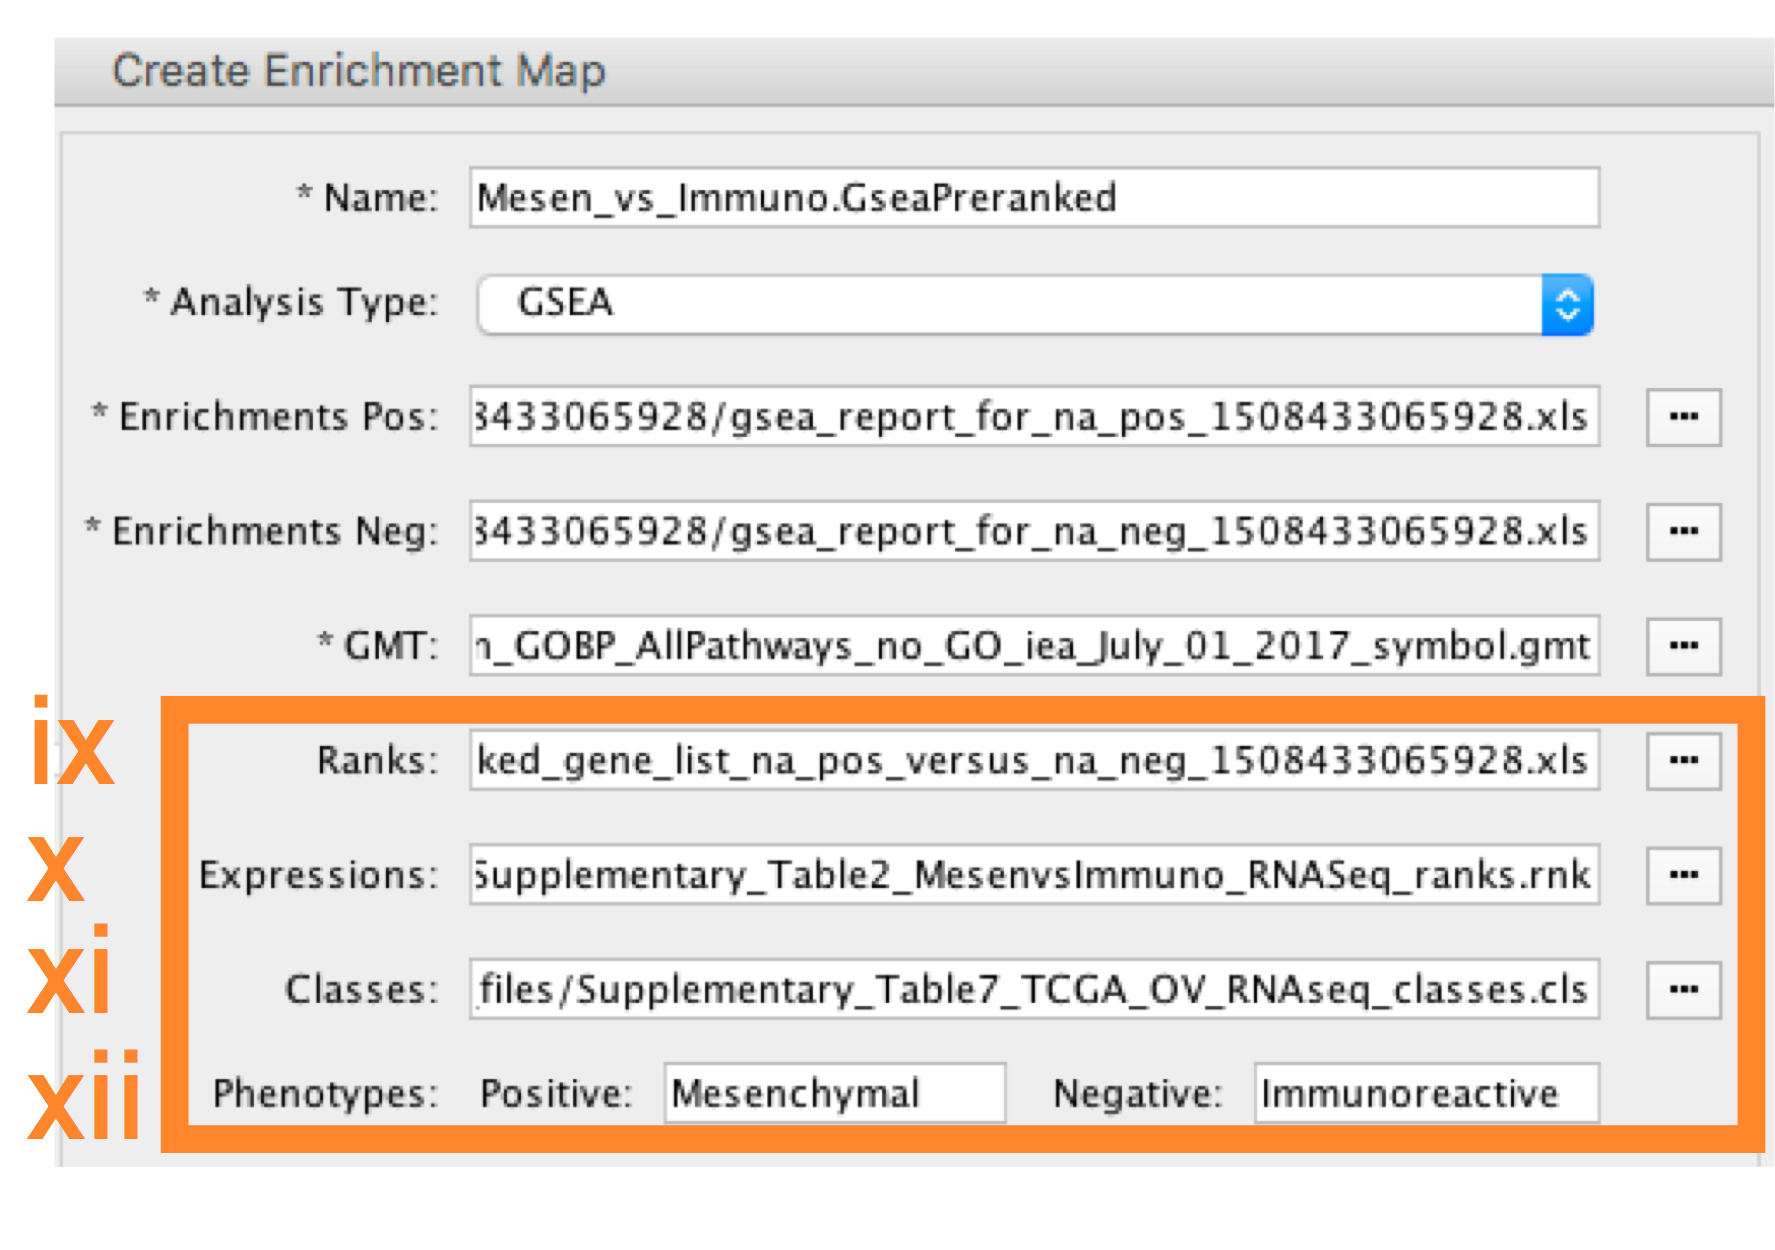
- Ranks - (Optional) Verify that the file is set to ranked_gene_list_na_pos_versus_na_neg_12345.xls where 12345 is a unique number generated by GSEA. Alternately, navigate to the file Supplementary_Table2_MesenvsImmuno_RNASeq_ranks.rnk).
-
- Expressions - (Optional) Supplementary_Table6_TCGA_OV_RNAseq_expression.txt).
-
- Classes – (Optional) GSEA CLS file defining the phenotype (i.e. biological conditions) of each sample in the expression file, for example, see Supplementary_Table7_TCGA_OV_RNAseq_classes.cls).
-
- Phenotypes – (Optional) In the text boxes replace ‘na_pos’ with ‘Mesenchymal’ and ‘na_neg’ with ‘Immunoreactive’. ‘Mesenchymal’ will be associated with red nodes as it corresponds to the positive phenotype while ‘Immunoreactive’ will be labeled blue.
Troubleshooting - Visualizing GSEA Results
- TROUBLESHOOTING: What is the random number appended to the GSEA directory name?
- Every GSEA analysis generates a random number that is appended to the names of the files and directories. The number will be different for every new analysis.
9B. Visualize enrichment results with EnrichmentMap use GSEA results - cont'd
- Number of Nodes: -
- Set FDR q-value cutoff to 0.01.
- Select Filter genes by expressions to exclude any genes in the gene set definition file (i.e. the gmt file) that are not found in the supplied expression file.
- If Filter genes by expressions is not selected, any gene that is not found in the expression file will be retained and will be presented in the expression heat map viewer with all of its associated expression values grayed out.
Troubleshooting - Visualizing GSEA Results
- TROUBLESHOOTING: Cannot provide a more precise value.
- Scientific notation is not enabled. To set the threshold to a small number, select ‘Scientific Notation’ and set a q-value cutoff such as 1E-04.
9B. Visualize enrichment results with EnrichmentMap use GSEA results - cont'd
- Number of Edges: -
- Keep the connectivity slider in the centre.
- If the network is too cluttered because of too many connections (edges), move the slider to the left to make the network sparser.
- Alternatively, if the network is too sparse (i.e. there are too many disconnected pathways), move the slider to the right to obtain a more densely connected network.
Troubleshooting - Visualizing GSEA Results
- TROUBLESHOOTING: What happens when you move the similarity slider bar?
- Moving the slider to the left (or right) will adjust the underlying similarity statistic threshold to make the resulting network sparser (or denser).
- The slider is set with predefined defaults but users can fine-tune the similarity metric by selecting "Show advanced options" at the bottom of the "Create Enrichment Map" panel.
- Predefined values appear as tick marks on the slider and include Jaccard > 0.35, Jaccard > 0.25, combined > 0.375, overlap > 0.5, overlap > 0.25.
9B. Visualize enrichment results with EnrichmentMap use GSEA results - cont'd
- Click the Build button at the bottom of the EnrichmentMap Input panel. A Building EnrichmentMap box appears and indicates the progress status. This box will disappear once the map has been created successfully.
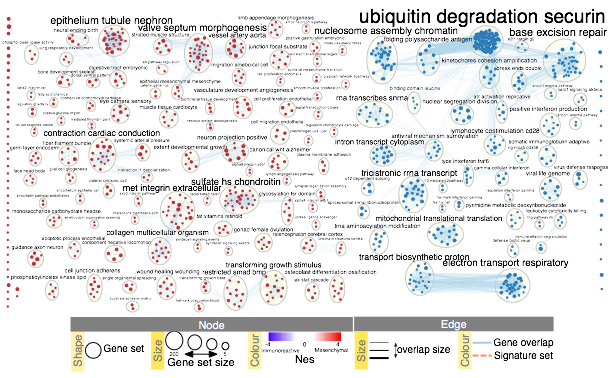
10. Resulting enrichment maps from g:Profiler and GSEA pipelines
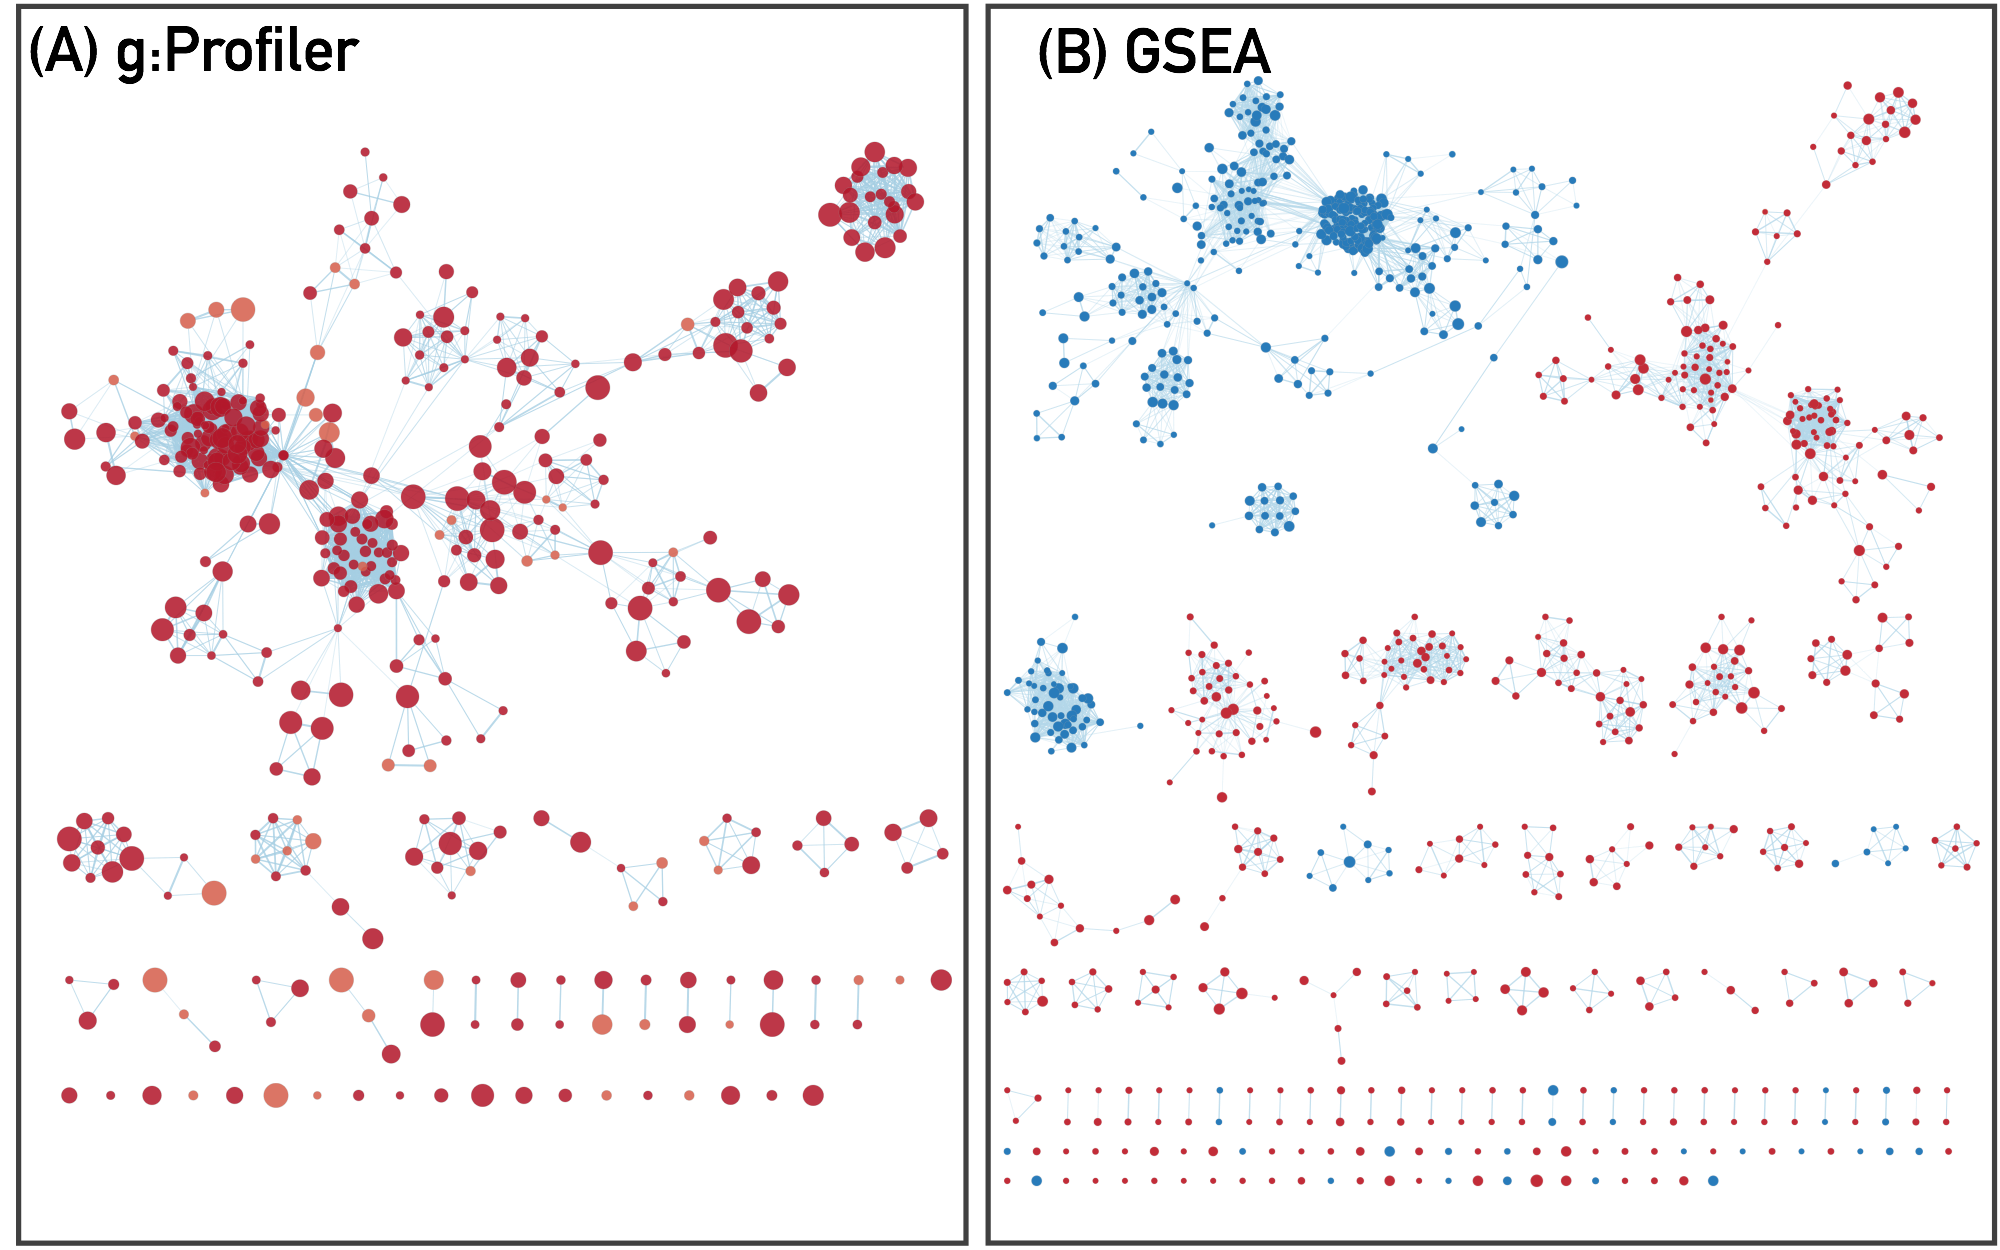
11. Navigating and interpreting the enrichment map
- An enrichment map must be interpreted to discover novel information about a data set and must be manually refined to create a publication quality figure.
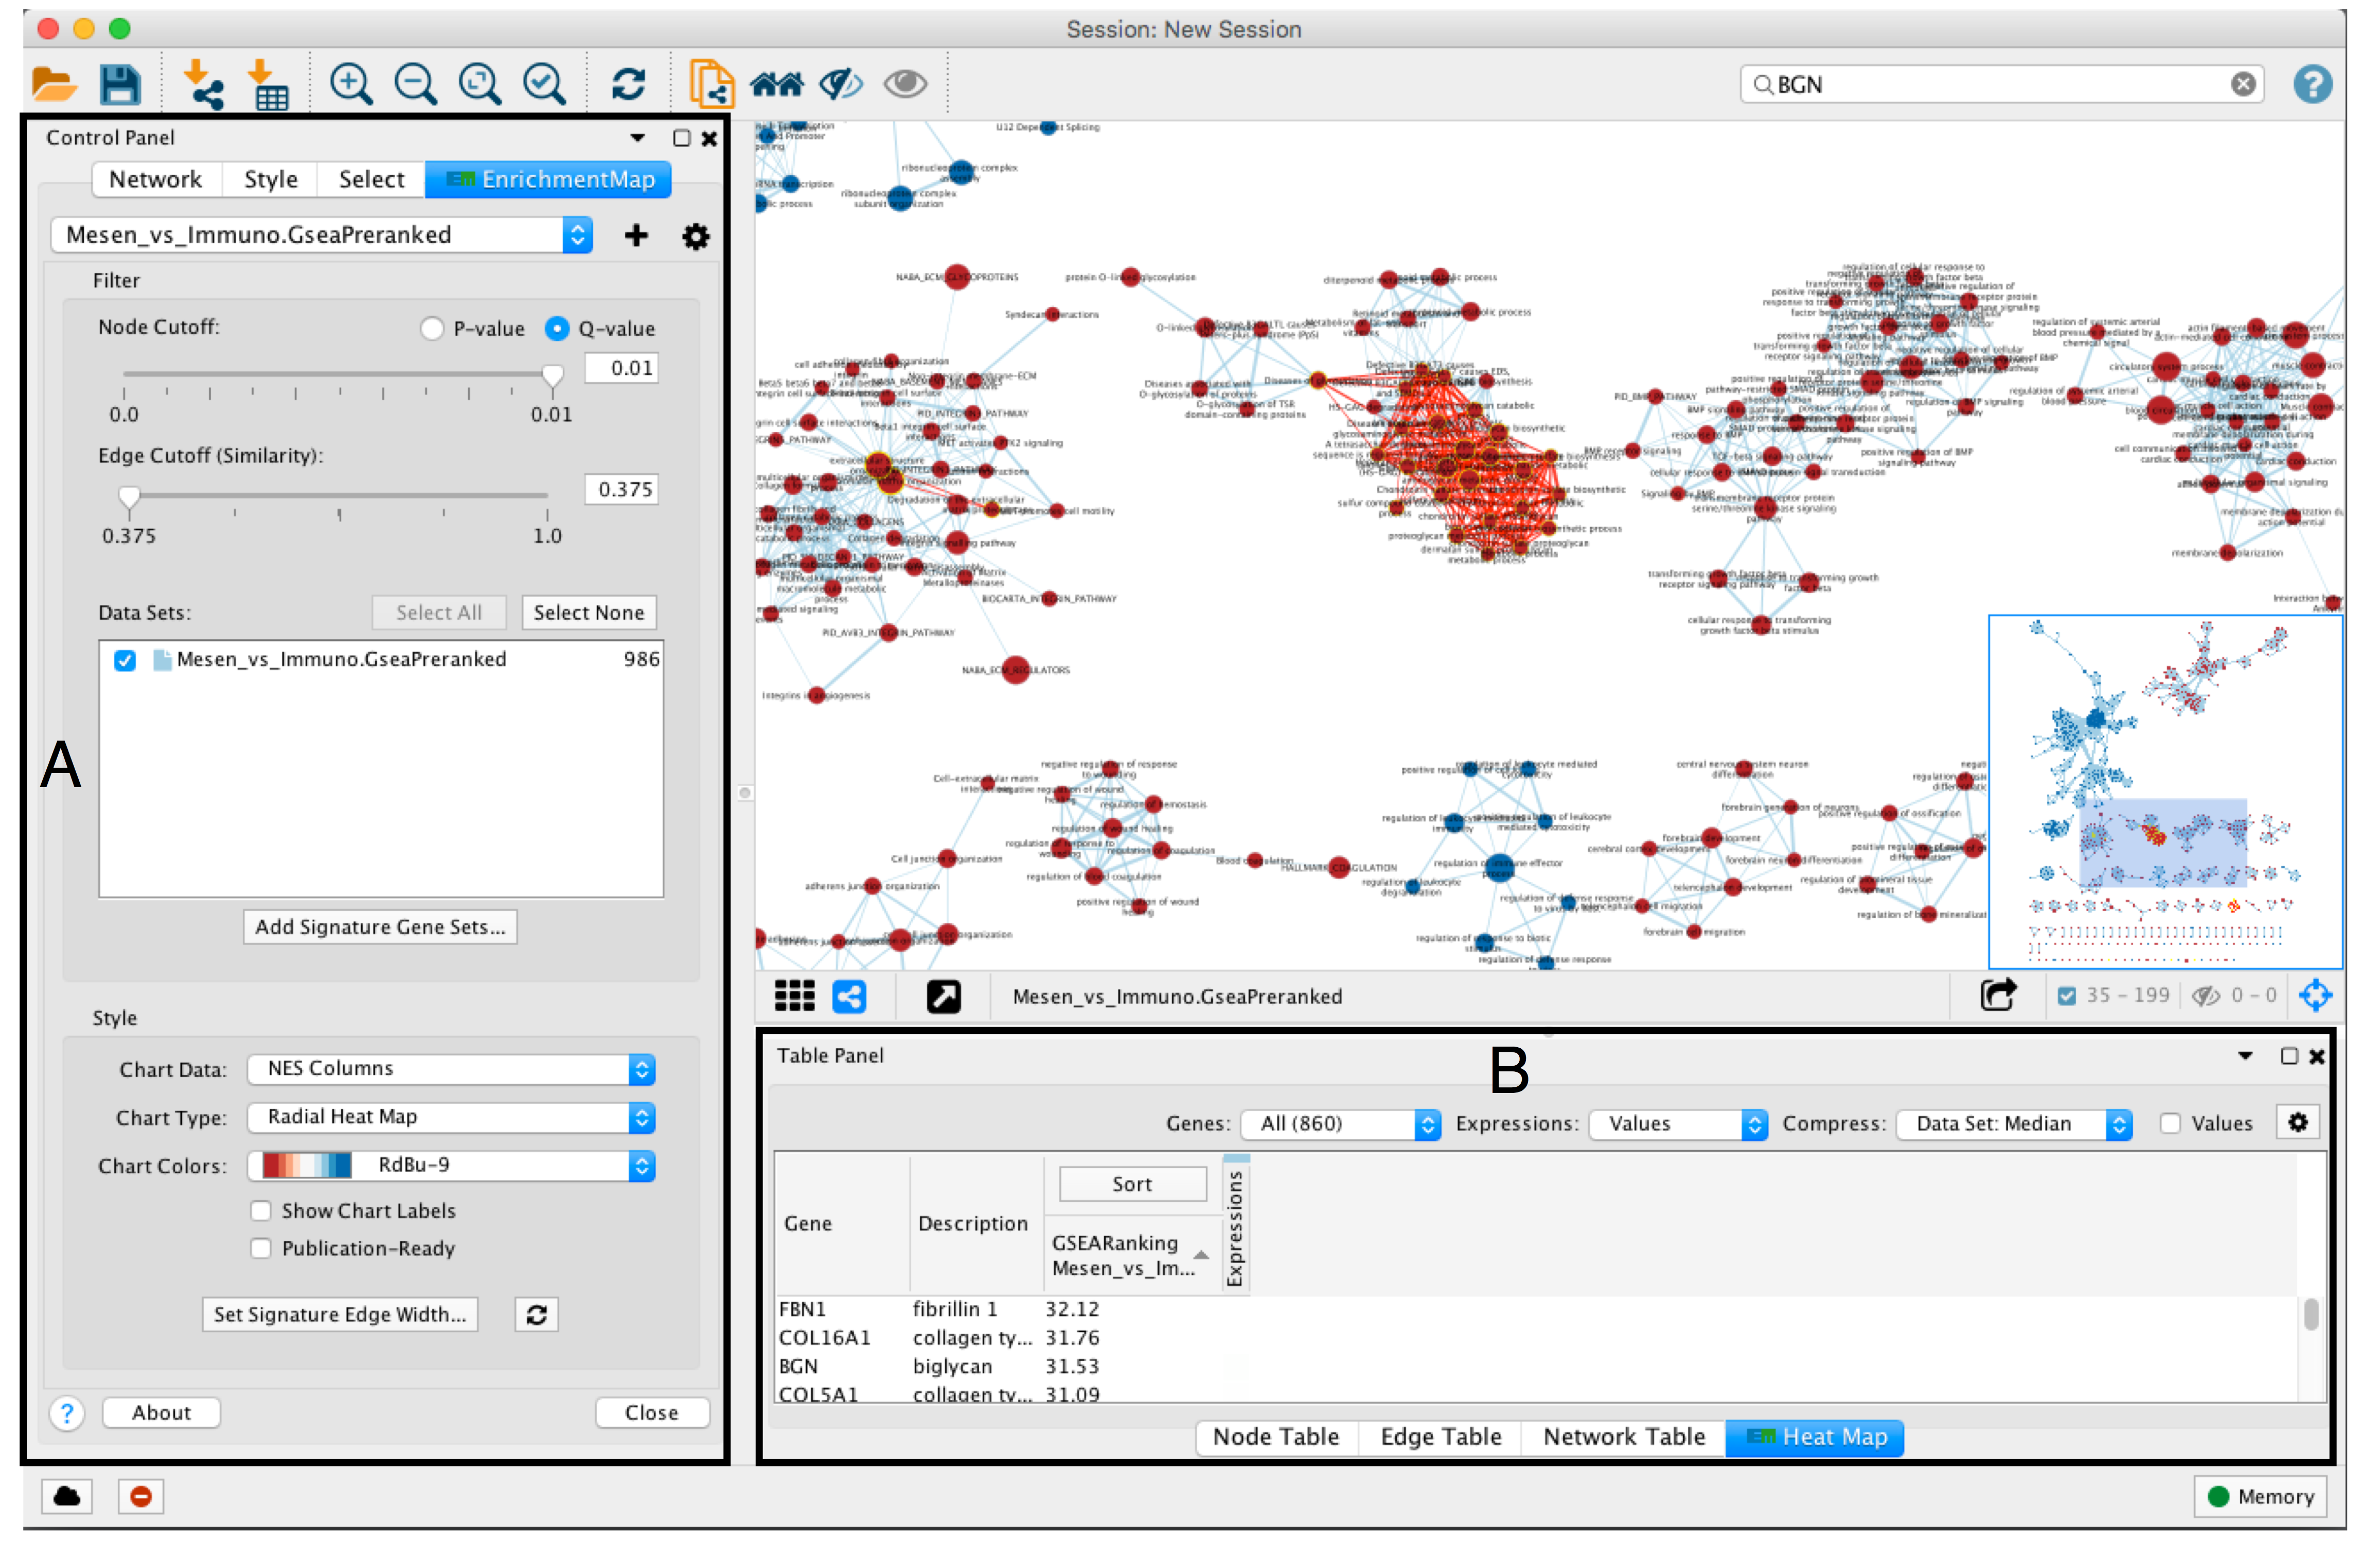
- To explore the enrichment map, select the network of interest in the Control Panel located at the left side of the Cytoscape window.
- The Network Panel can be selected using the left most tab of the Control Panel.
- The selected network appears in the main window, navigate to it (zoom and pan) using Cytoscape controls (section A) and explore the pathways by reading the gene set labels.
- Pathways with many common genes often represent similar biological processes and are grouped together as sub-networks or themes in the network. Click on a node to display the corresponding genes in the table below the network view (section B).
Troubleshooting - Navigating Results
- TROUBLESHOOTING: Few or no pathways present in enrichment map.
- A pathway enrichment analysis resulting in few or no enriched pathways may be caused by suboptimal statistical processing used to define the original gene list.
- Enriched pathways are unlikely to be found if the gene list ranks are too noisy and the most important genes are not at the top of the list, no genes are highly significant, or a large fraction of genes are highly significant.
- If the gene list has been correctly defined, analyzing further databases of pathways and gene sets or setting more liberal filters may improve results.
12. Find specific genes
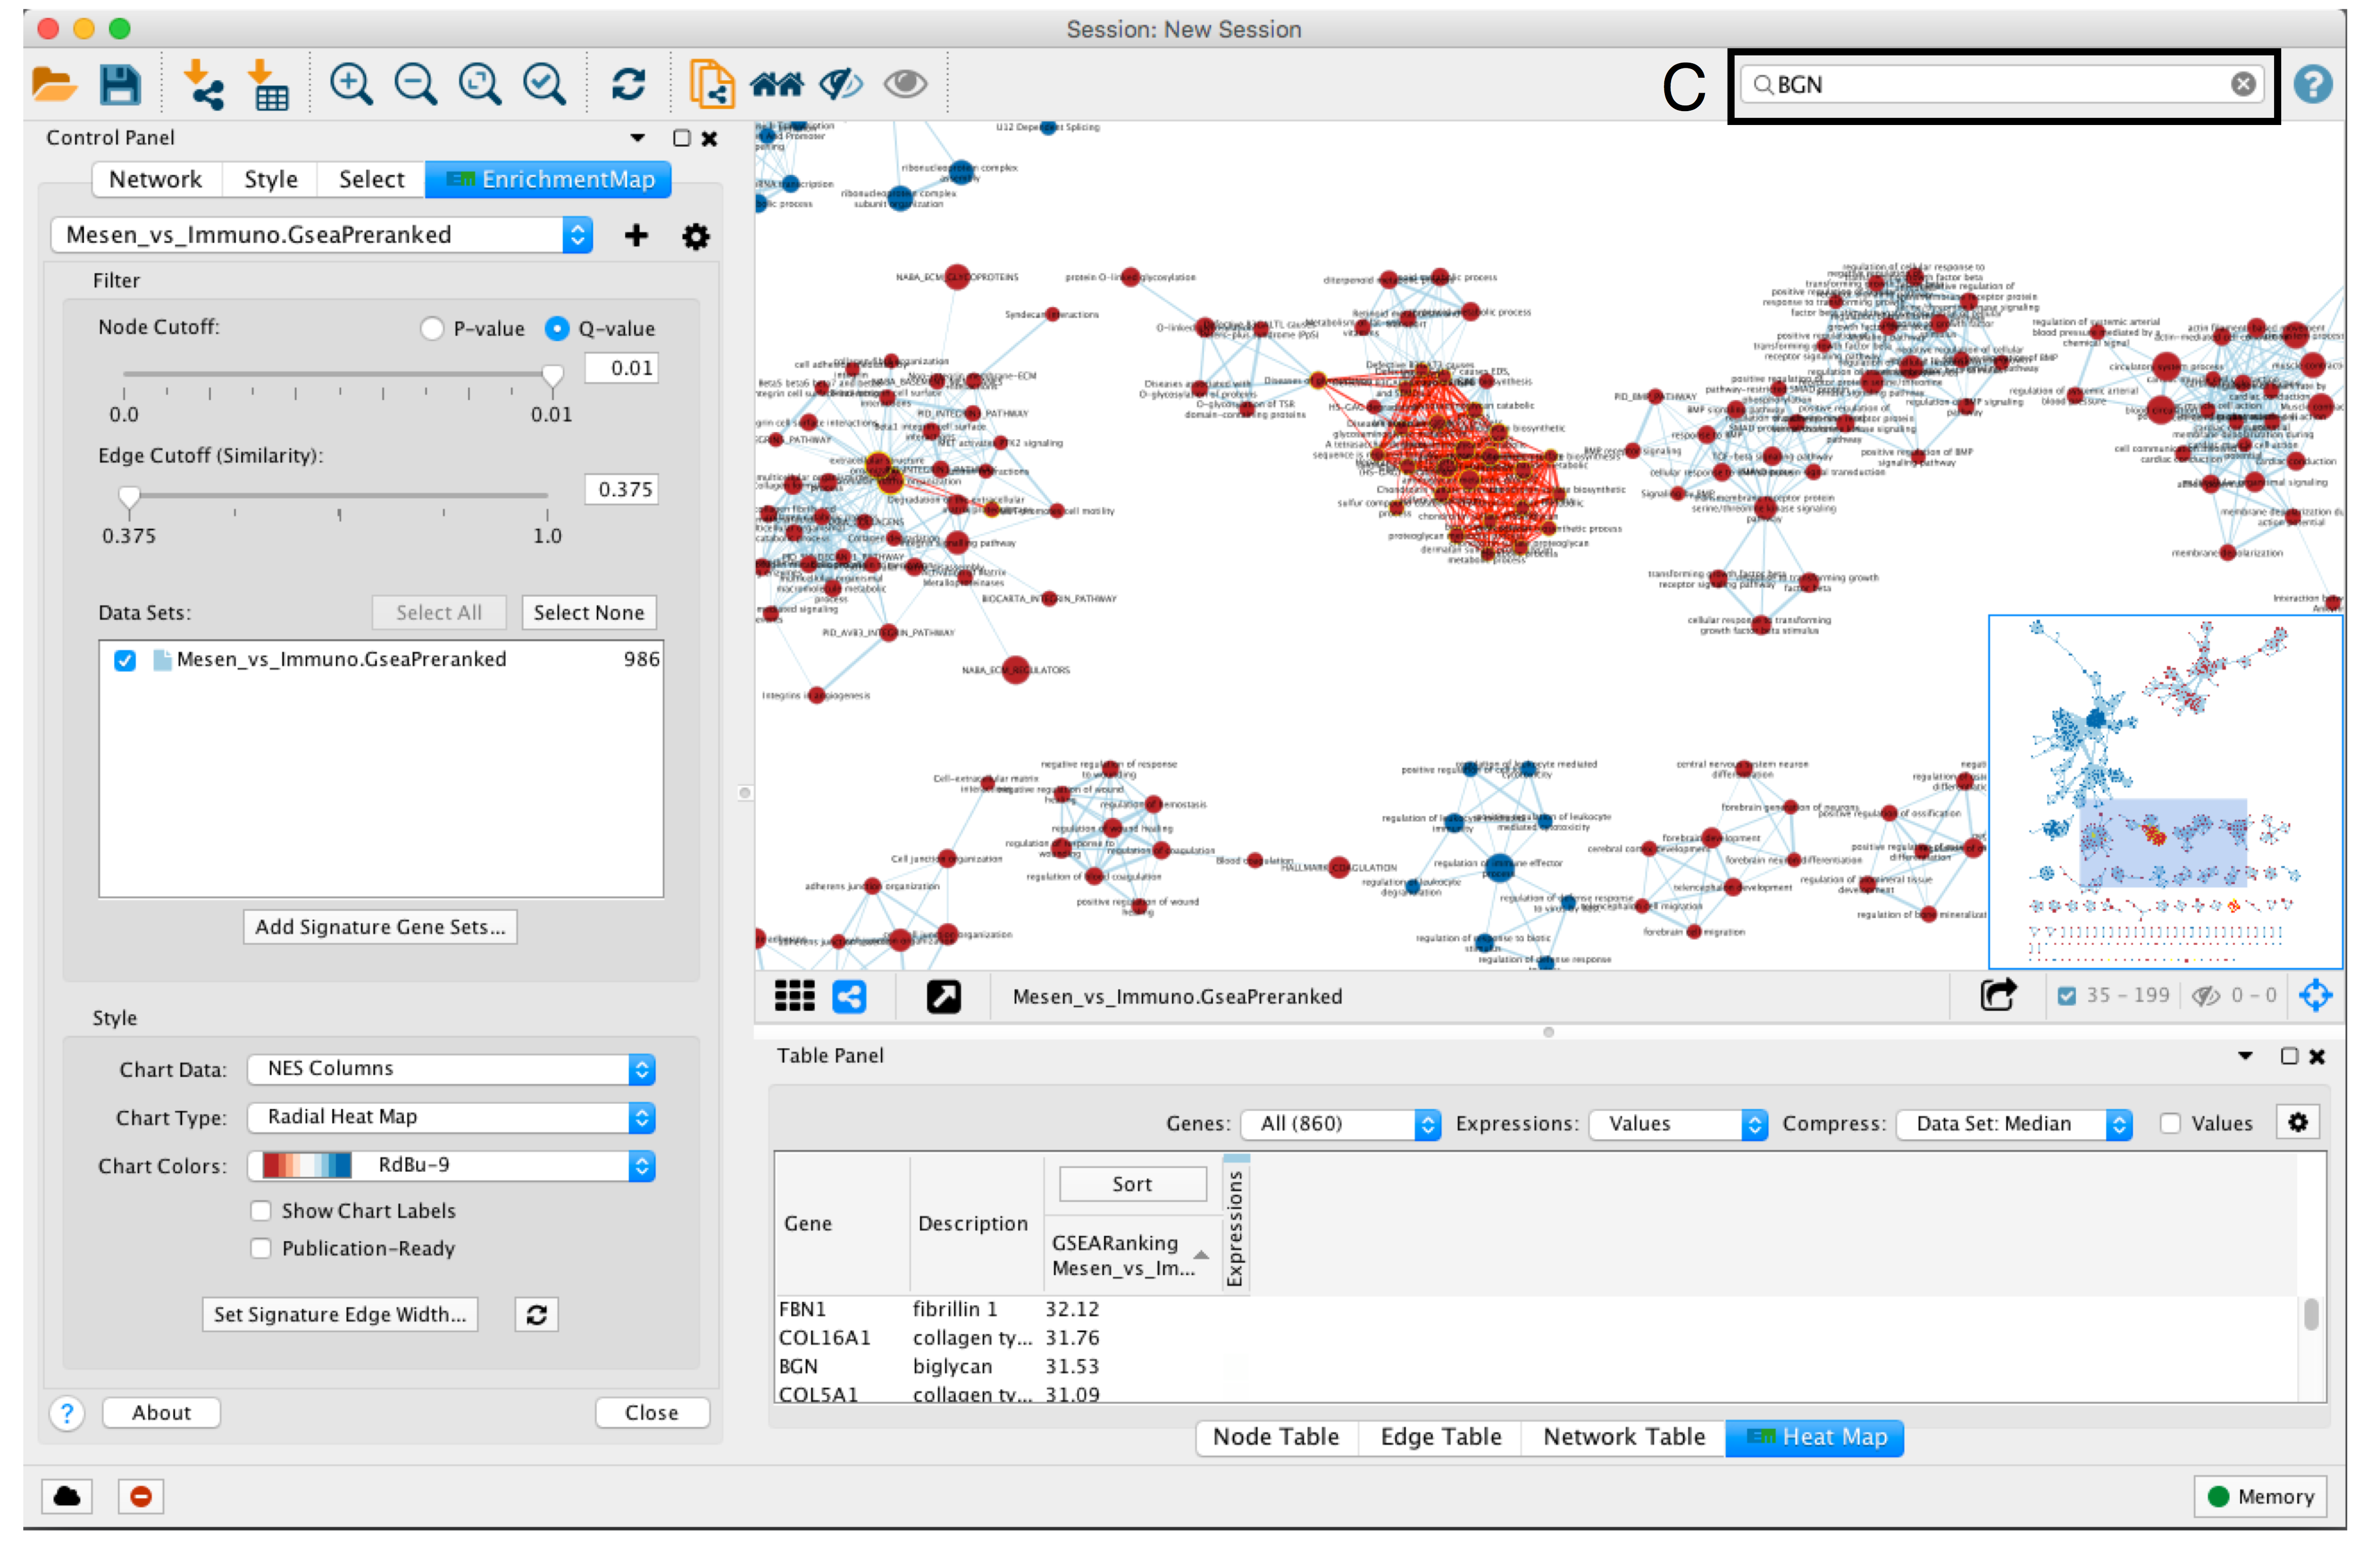
- To find a gene or pathway of interest, type its name in the search bar located in the top right corner (section C).
- All pathways containing that gene will be highlighted. For example, TP53 and BGN are the top genes in g:Profiler and GSEA analyses, respectively.
Troubleshooting - Navigating Results
- TROUBLESHOOTING: Cannot find any pathways with my search gene.
- Check that the gene identifier type used for the search matches the identifier type used in the analysis.
- Multiple genes separated by spaces can be entered into the search bar. Any pathway that contains the gene will be selected and highlighted in the network.
- Adding keywords “AND” into the search bar will show only pathways that contain all genes in the search query (e.g. "geneA AND geneB").
- If the original analysis did not use gene symbols then you will not be able to search by gene symbols. Instead use the identifier type that the analysis was based on, for example Entrez Gene ID or Ensembl gene ID.
13. Find most enriched pathways
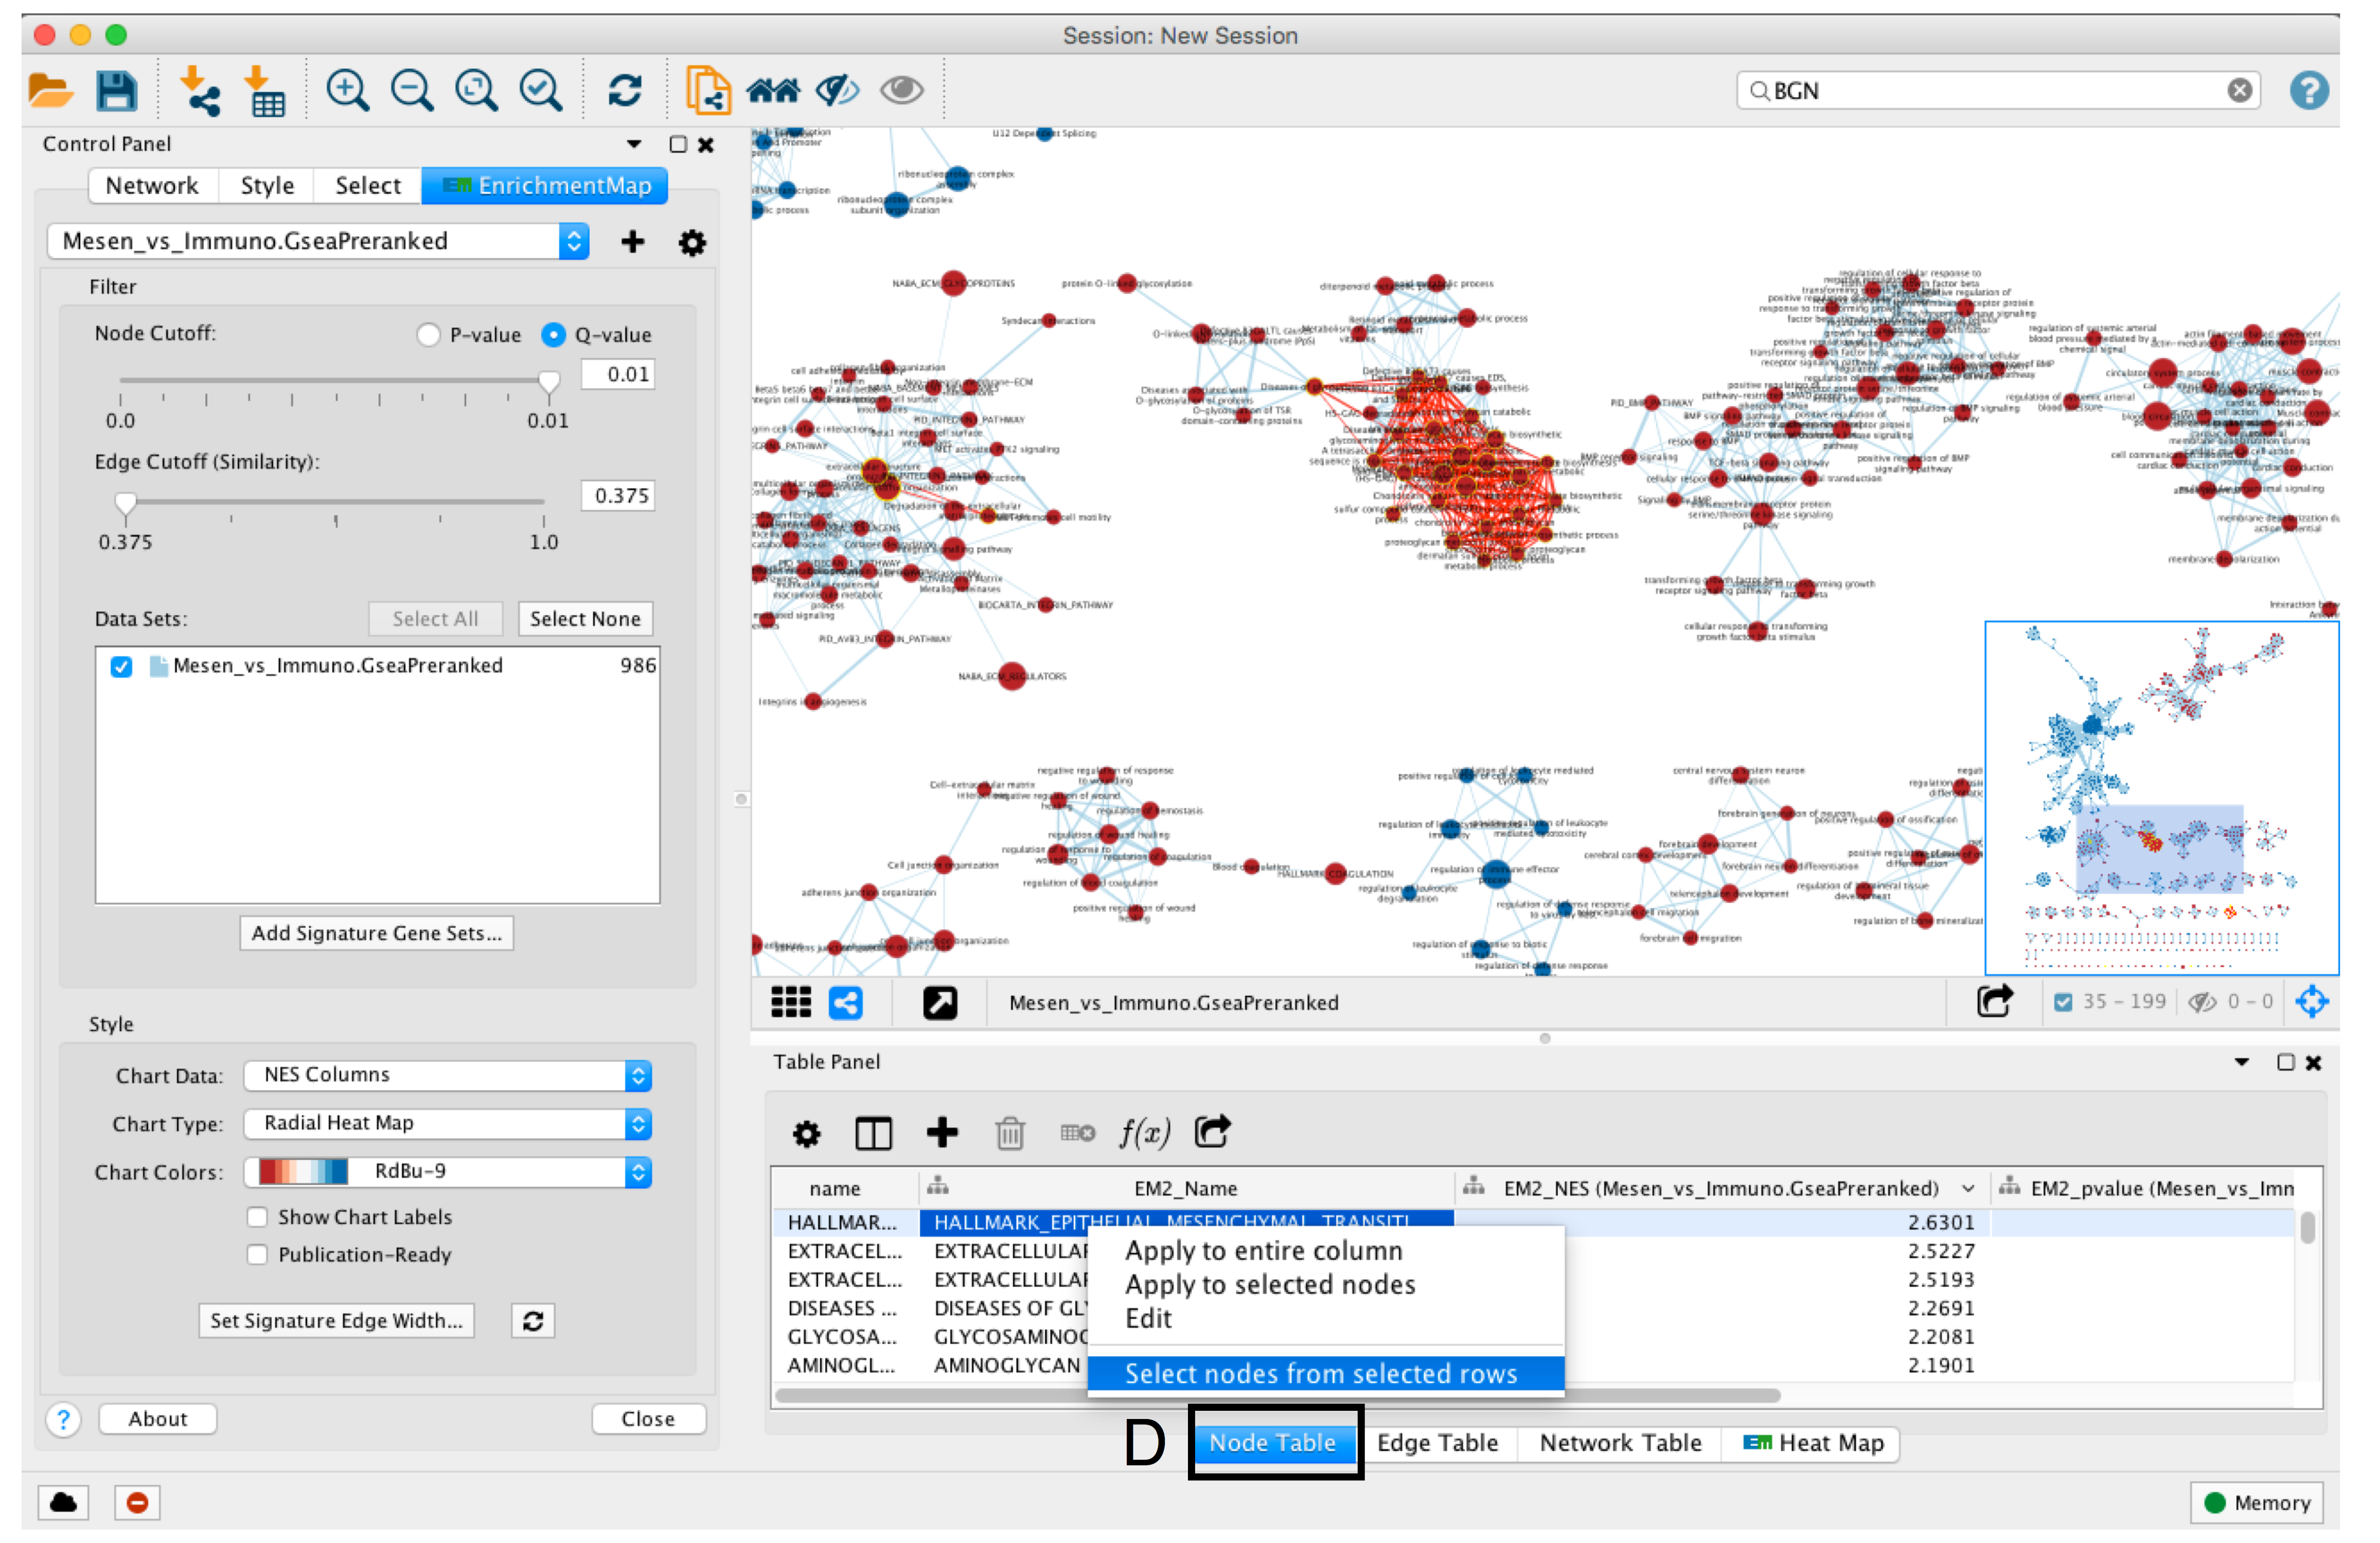
- To find the most enriched pathways, look at the Table Panel located below the network view.
- Select the Node Table tab (section D)
- select and sort the column named “EM#_fdr_qvalue” (for g:Profiler) or “EM#_NES” (for GSEA) by clicking on the column header.
- To highlight a subset of these pathways in the network, select rows corresponding to pathways of interest, right-click on any selected row in the table and select “Select nodes from selected rows”.
Troubleshooting - Navigating Results
- TROUBLESHOOTING: Very few entries in node table although the network contains many nodes.
- Some nodes in the network are already selected.
- If there are very few records in the node table make sure that no nodes are selected in the network. Or click on the gear icon and change the setting from “Auto” to “Show all”.
14. Expression Viewer

- When a gene expression matrix is provided as input to EnrichmentMap, we can study the expression pattern of the genes included in enriched pathways.
- Click on an individual node to generate a gene expression heat map that will appear in the Heat Map tab of Table Panel.
- If the analysis is based on GSEA results and a rank file is supplied, the leading edge genes will be highlighted in yellow for individual node selections. Several options for heat map visualization are available.
Troubleshooting - Navigating Results
- TROUBLESHOOTING: An expression matrix was not supplied.
- If no expression file is input to EnrichmentMap it will automatically create a dummy expression file where any gene found in the enrichment file will be given a placeholder expression value of 0.25, and any gene found in a pathway but not found in the enrichment results file be assigned a placeholder expression value of NA. Therefore clicking on any node in the enrichment map will show the genes used for the analysis as well as genes in the pathway that are not part of the query set.
14. Expression Viewer - cont'd
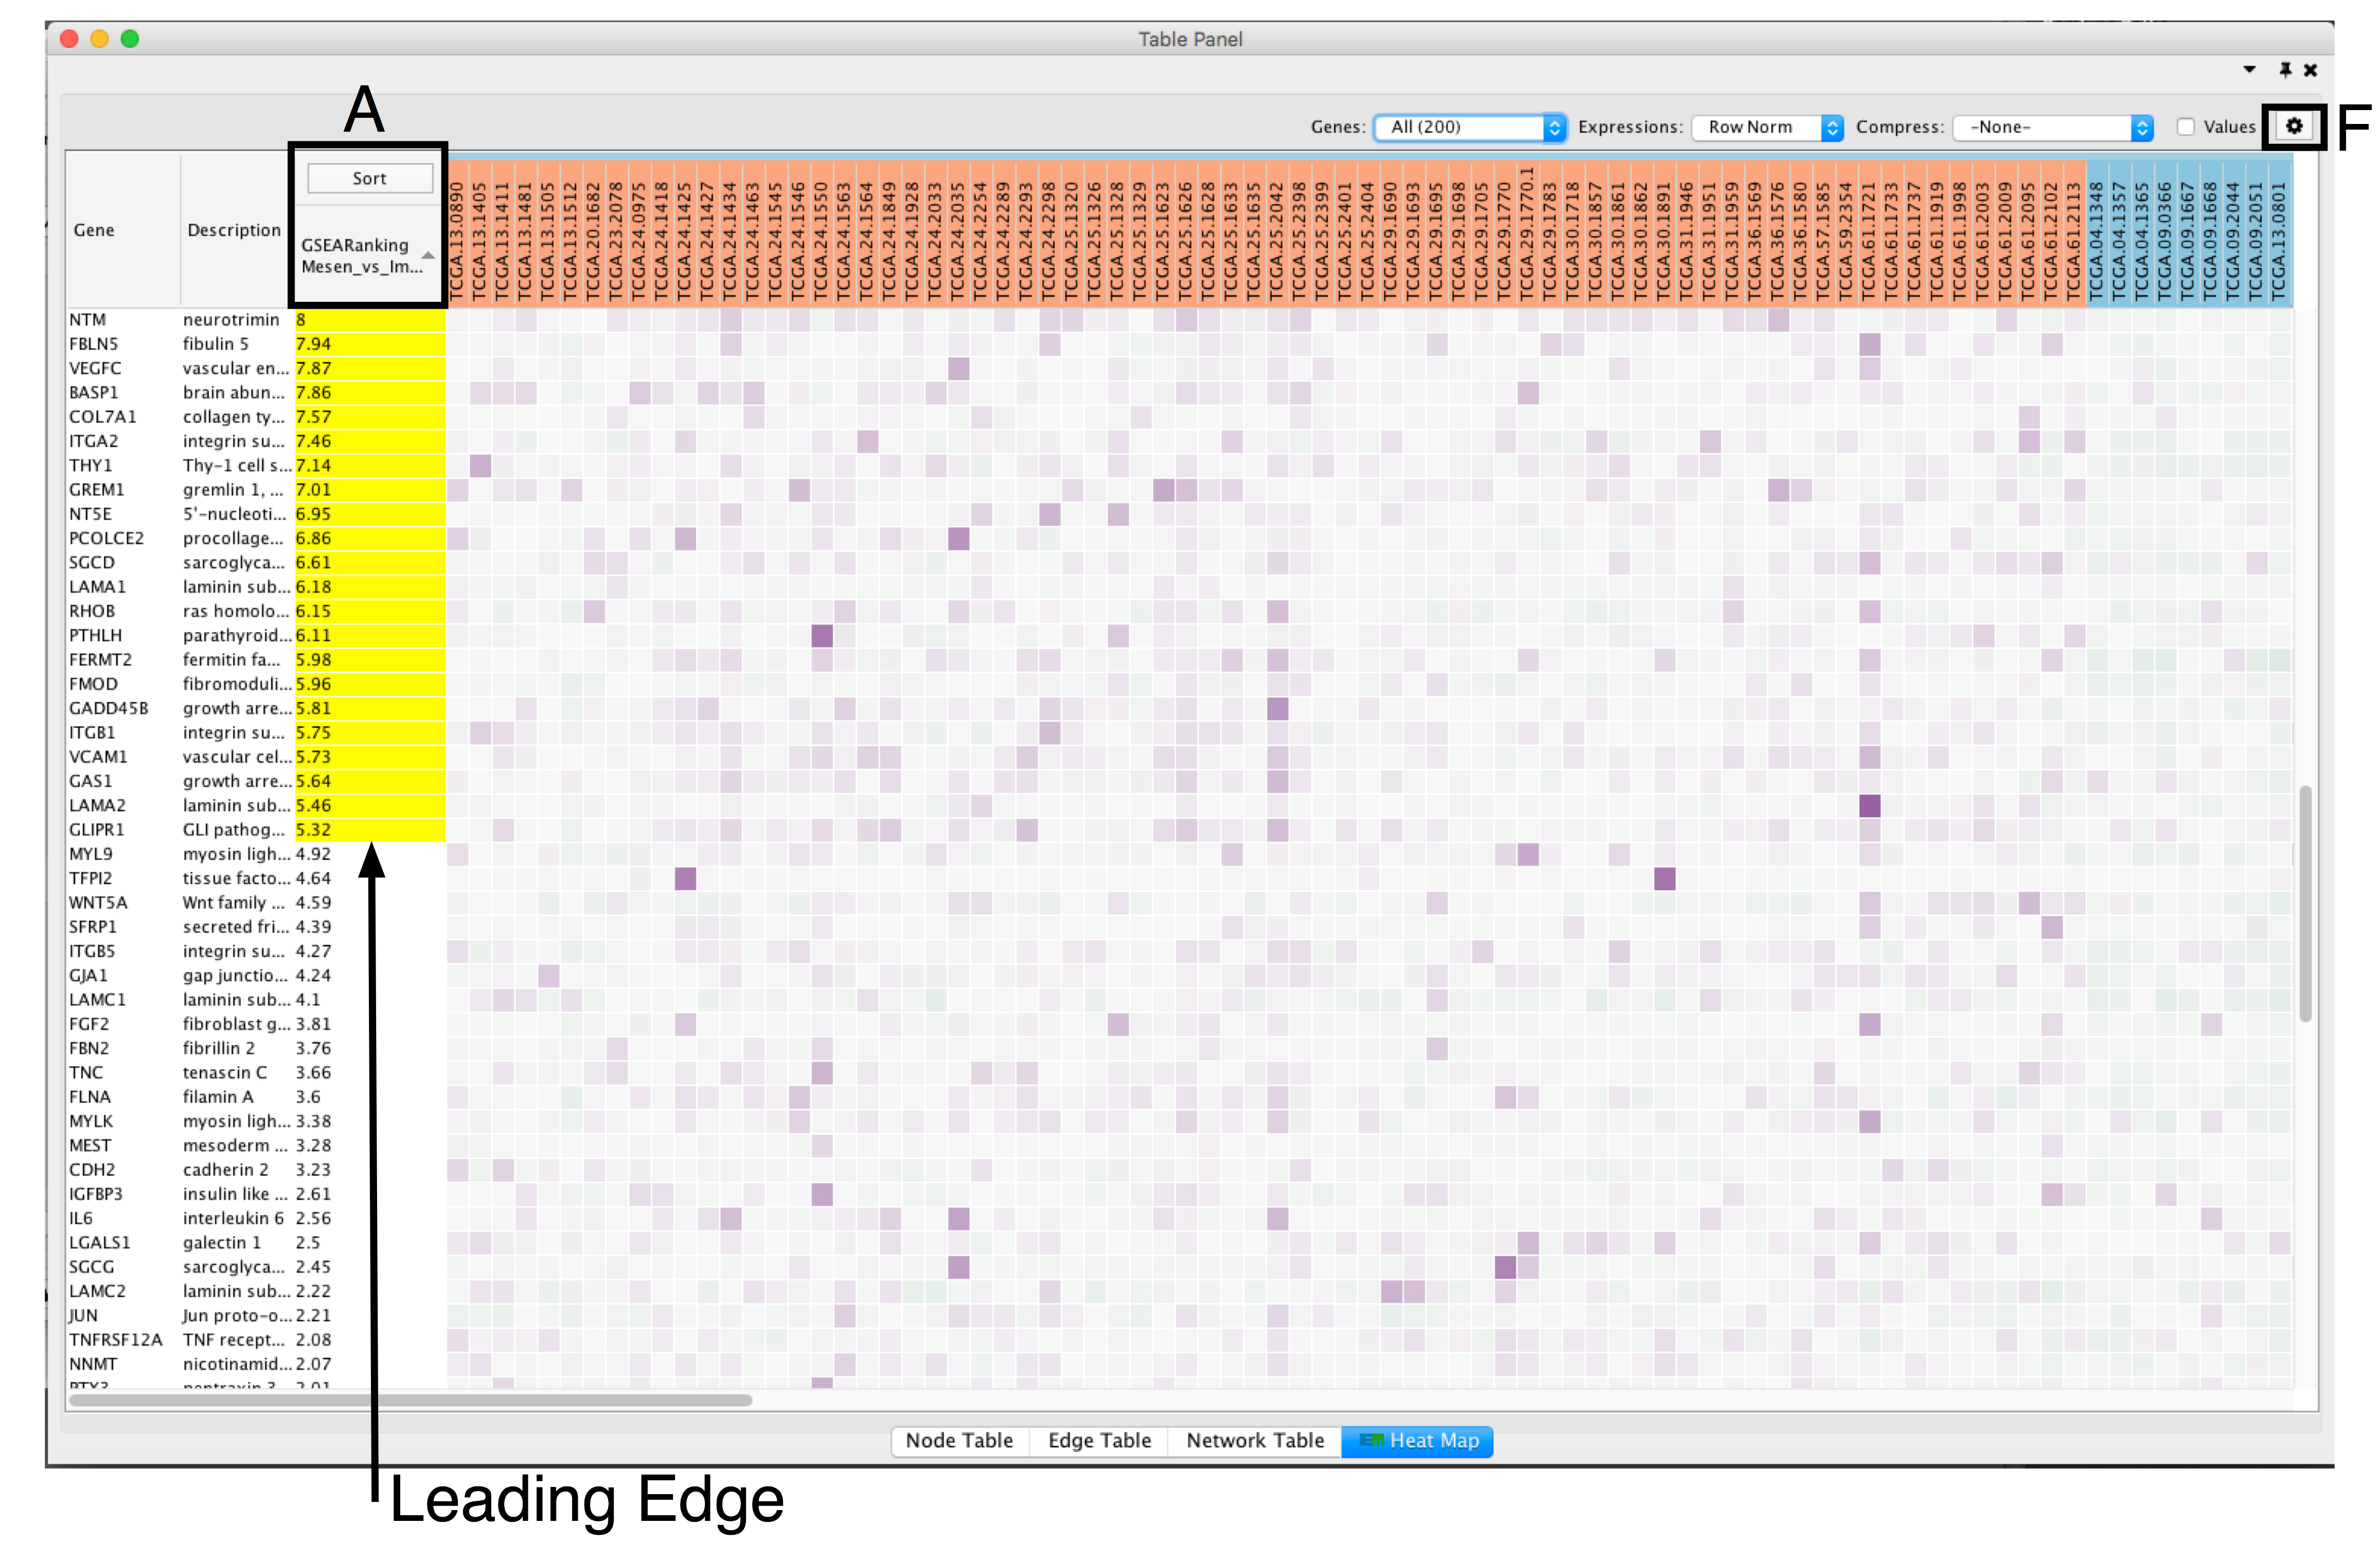
- Adjust the Sort option: sorting options include hierarchical clustering, ranks, or no sorting. To change the sorting option, click on the Sort button visible in the top left corner of the heat map table (section A).
- By default, the heat map is sorted by ranks if a rank file is supplied. In the absence of a rank file, no sort is applied. Additional rank files can be uploaded for comparison through the settings menu located at the top right corner in the Heat Map Panel (section F). .
- If the analysis is based on GSEA results and a rank file is supplied, the leading edge genes will be highlighted in yellow for individual node selections. Several options for heat map visualization are available.
14. Expression Viewer - cont'd
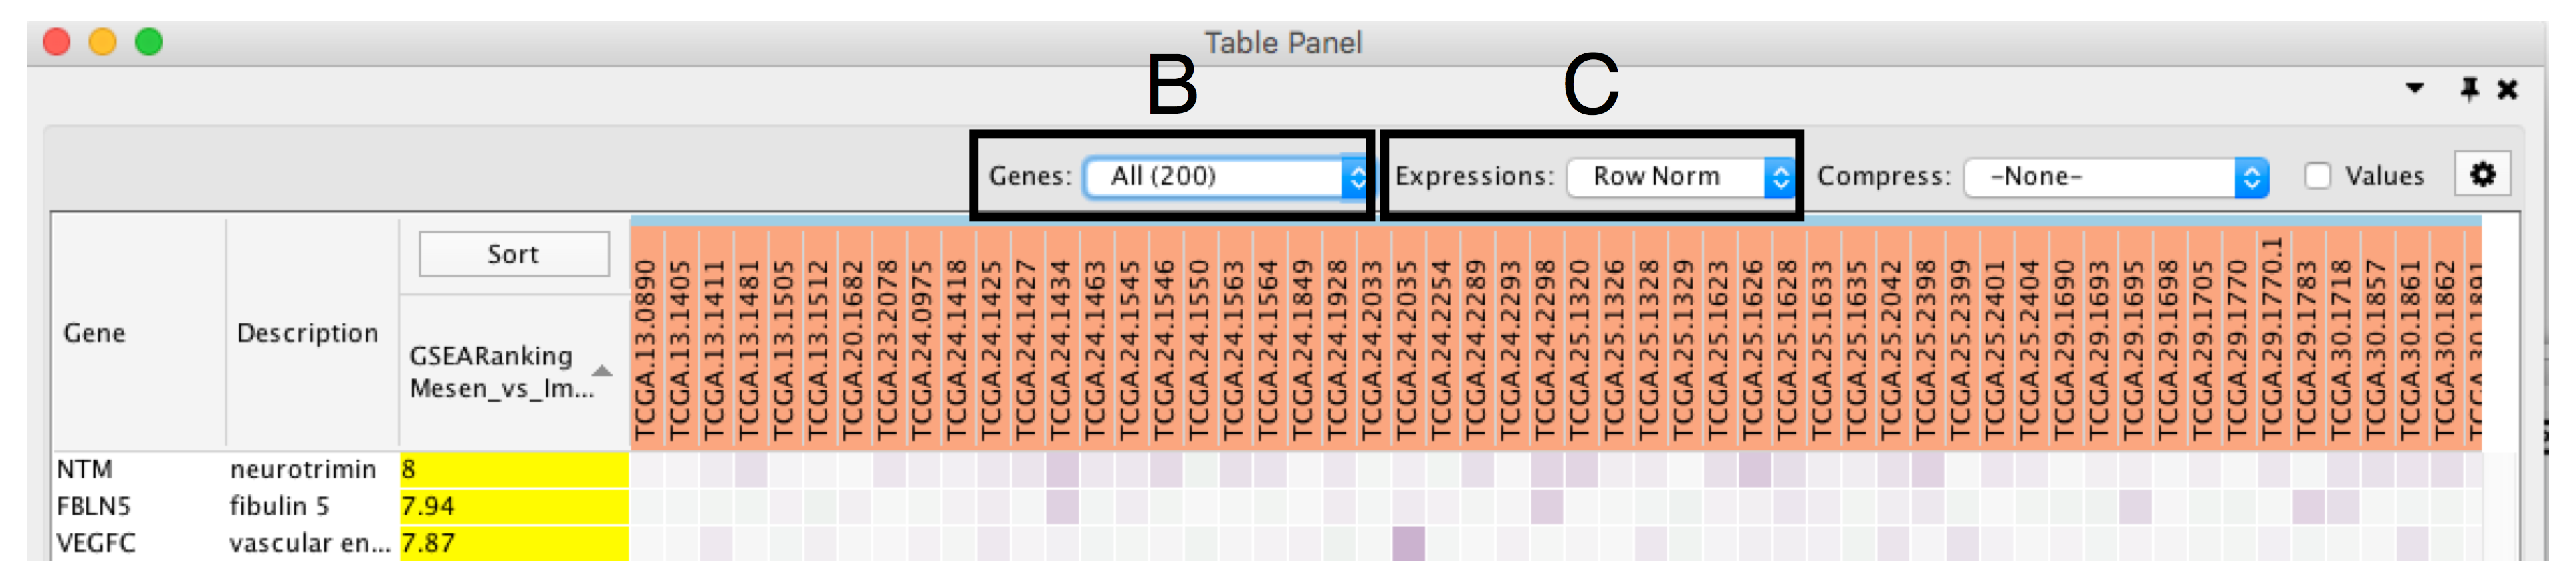
- Define Genes you wish to visualize in the heat map (section Bb). Data can be viewed for all genes contained in the selected nodes (union of nodes) or just for the genes common to selected nodes (intersection of nodes). By default, all genes are shown.
- Change Expressions value visualization depending on your data type (section C). Data can be viewed as it was loaded (Values), or row normalized where the row mean is subtracted from every value and then divided by the row’s standard deviation (Row Norm), or log transformed (Log).
14. Expression Viewer - cont'd
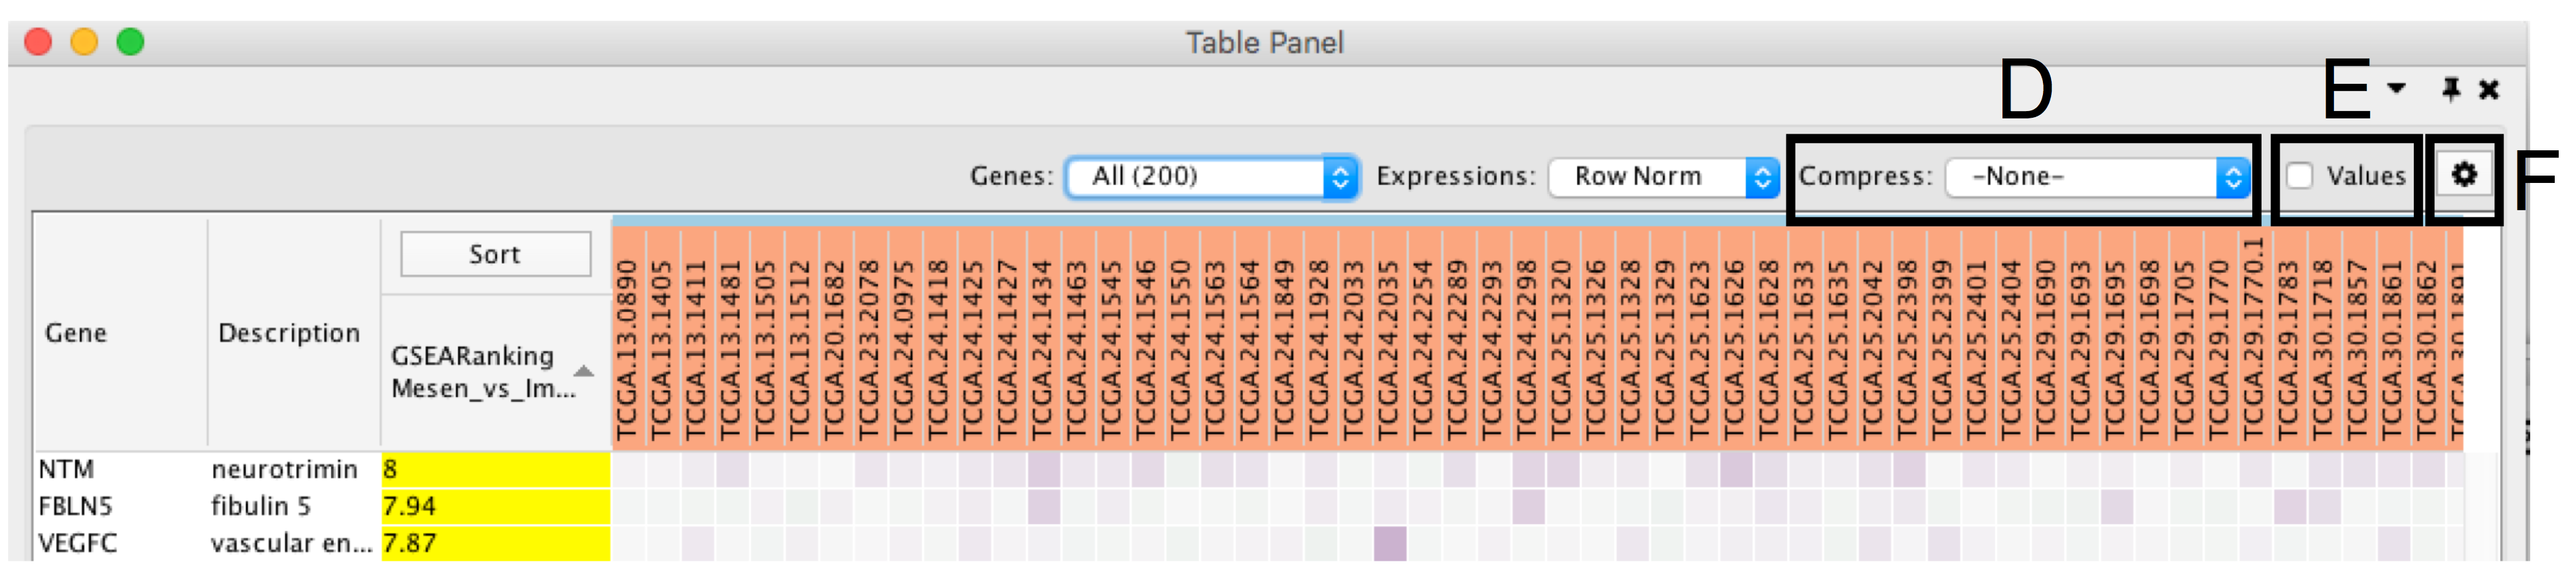
- Compress heat map columns (section 8D). By default, all expression values are visible as individual columns in the heat map for expression sets with less than 50 samples. It is possible to compress the data in a single column by selecting Compress, Data Set using the aggregation methods Median, Max (maximum) or Min (minimum). If a CLS file has been uploaded, the expression set can be compressed using one column per defined sample group using the Class option. If the expression matrix contains 50 samples or more, EnrichmentMap will automatically compress the values to their median value by default.
- Check Values (section E) to show the expression numerical values in addition to the heat map color scale.
- Additional fine tuning of the heat map can be done through the Settings Panel (section F) that includes functionality to add new rank files, export the heat map data as a tab delimited text file or PDF image, change the distance metric for hierarchical clustering, or turn on the node table heat map autofocus.
14. Expression Viewer - cont'd
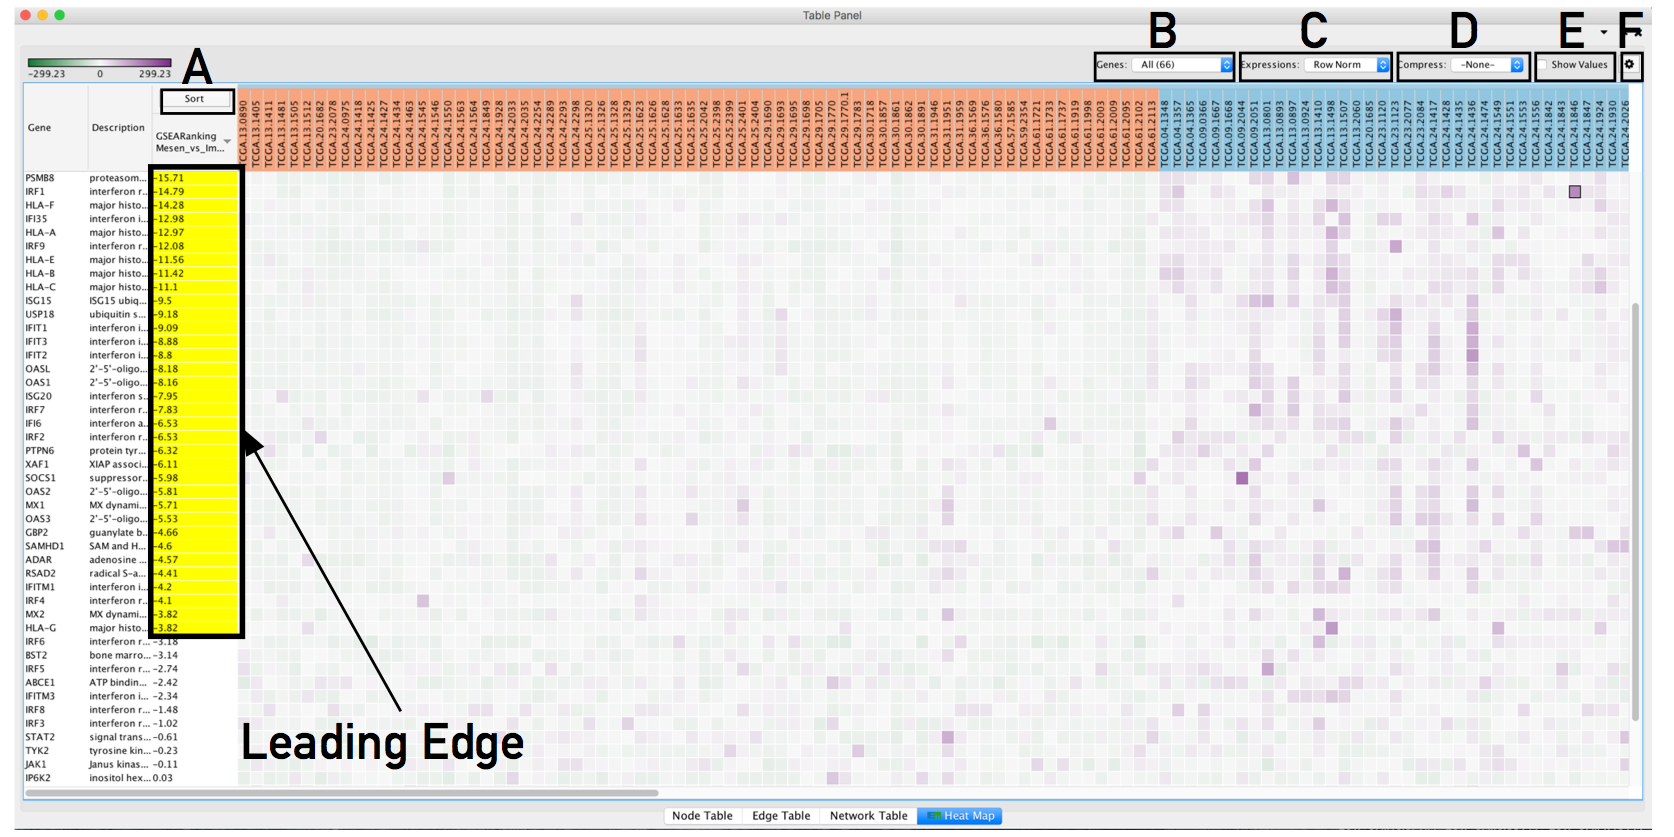
- The resulting heat map.
- On this figure, genes are sorted using the GSEA rank file, highlighting the leading edge in yellow.
- All genes contained in selected nodes are shown,
- expression values are row normalized,
- no compression is applied and individual expression numerical values are not shown.
- Column headings are colored according to sample phenotype. Red color refers to the first phenotype (Mesenchymal), and blue to the second phenotype (Immunoreactive).
Troubleshooting - Navigating Results
- TROUBLESHOOTING: Heatmap column names are not colored by dataset
- No CLS file loaded or mismatch between CLS file and phenotype definition.If the heat map columns are not colored for a GSEA analysis, make sure the phenotype names specified in the EnrichmentMap input panel match the class names specified in the class file (MesenchymalvsImmunoreactive_RNA-Seq_classes.cls). Also see TROUBLESHOOTING 9Bxiii.
14. Expression Viewer - cont'd
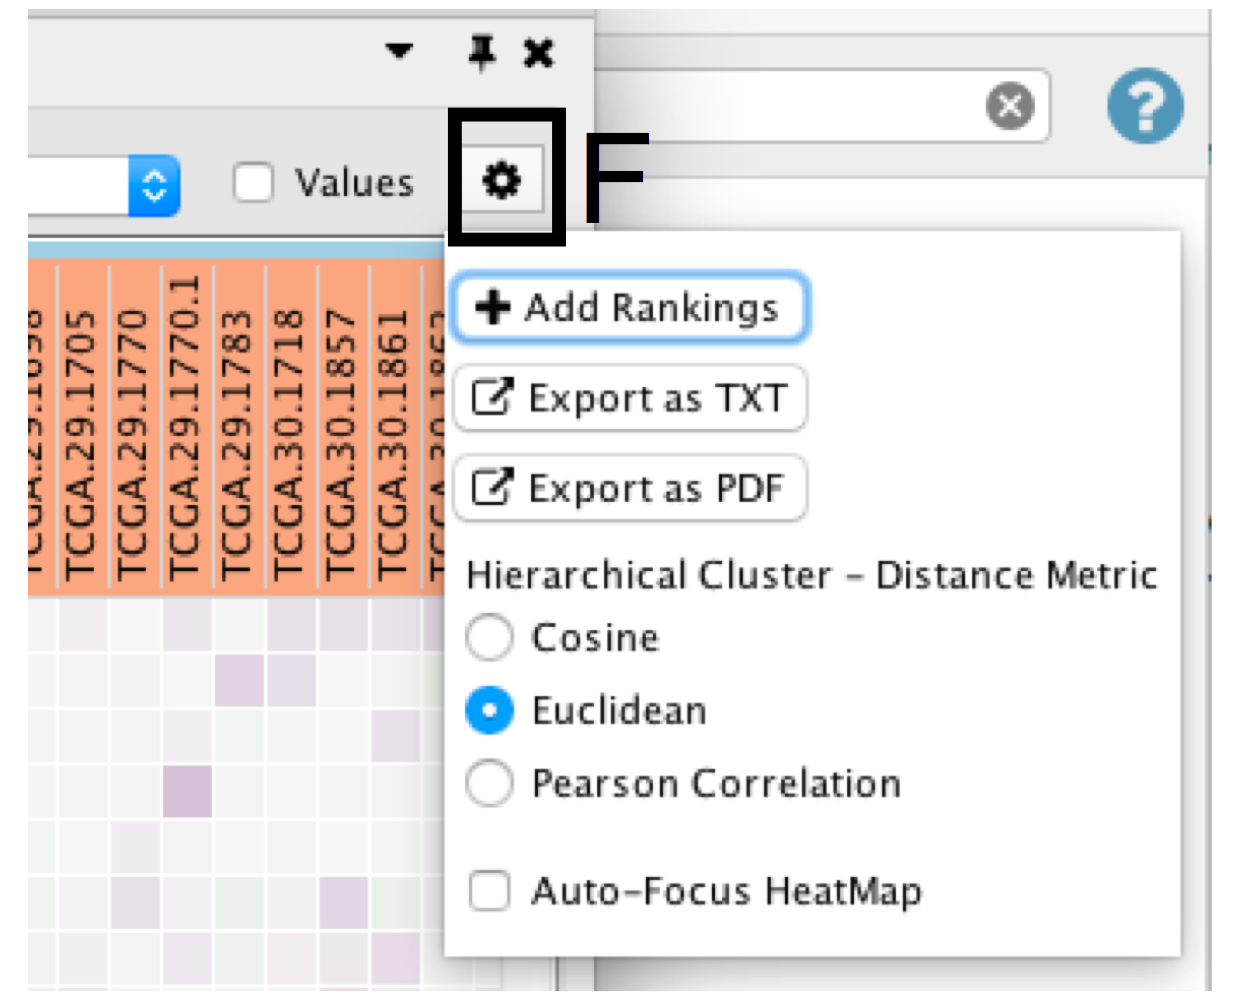
- Click on the Settings icon of the heat map (section F) and select Export as TXT.
- If only an individual node is selected, a dialog will offer to export the Leading edge only for GSEA analysis. If selected, only the highlighted genes will be exported; otherwise, the entire set of genes is saved.
- Specify the file name and location and click Save.
Troubleshooting - Navigating Results
- TROUBLESHOOTING: Option to save only leading edge genes is not given.
- Selection includes more than one node or data set contains no leading edge information (i.e was not built from GSEA results)
- The leading edge is only available for GSEA analyses. The option will only appear if the Enrichment map was built with GSEA results and a rank file was specified.
15. Organize and clarify the network
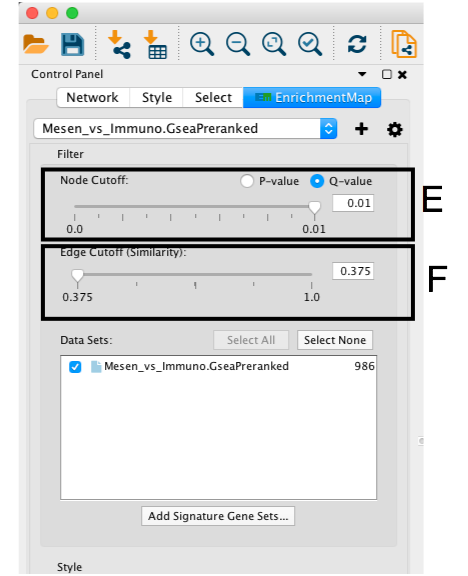
- If the network has too many nodes, go to the EnrichmentMap tab in the Control Panel and use the Node Cutoff Q-value threshold slider. Adjusting to a numerical value closer to 0 will remove less significant nodes (section E)
- If the network is too interconnected, go to the EnrichmentMap tab in the Control Panel and increasing the Edge Cutoff (Similarity) threshold will remove connections between less related nodes (section F ).
- The network layout may be applied again after adjusting the cutoffs (see the Layout menu in Cytoscape). The default layout algorithm is the unweighted Prefuse Force Directed layout. We also recommend the prefuse force-directed layouts weighted using the gene set similarity coefficient. Alternative layout algorithms are available and we encourage experimenting with them.
- To restore nodes or edges, adjust threshold sliders to their original positions.
15. Organize and clarify the network - cont'd
- It can be helpful to separate two different phenotypes (i.e. place all the red nodes to one side and all blue nodes to the other).
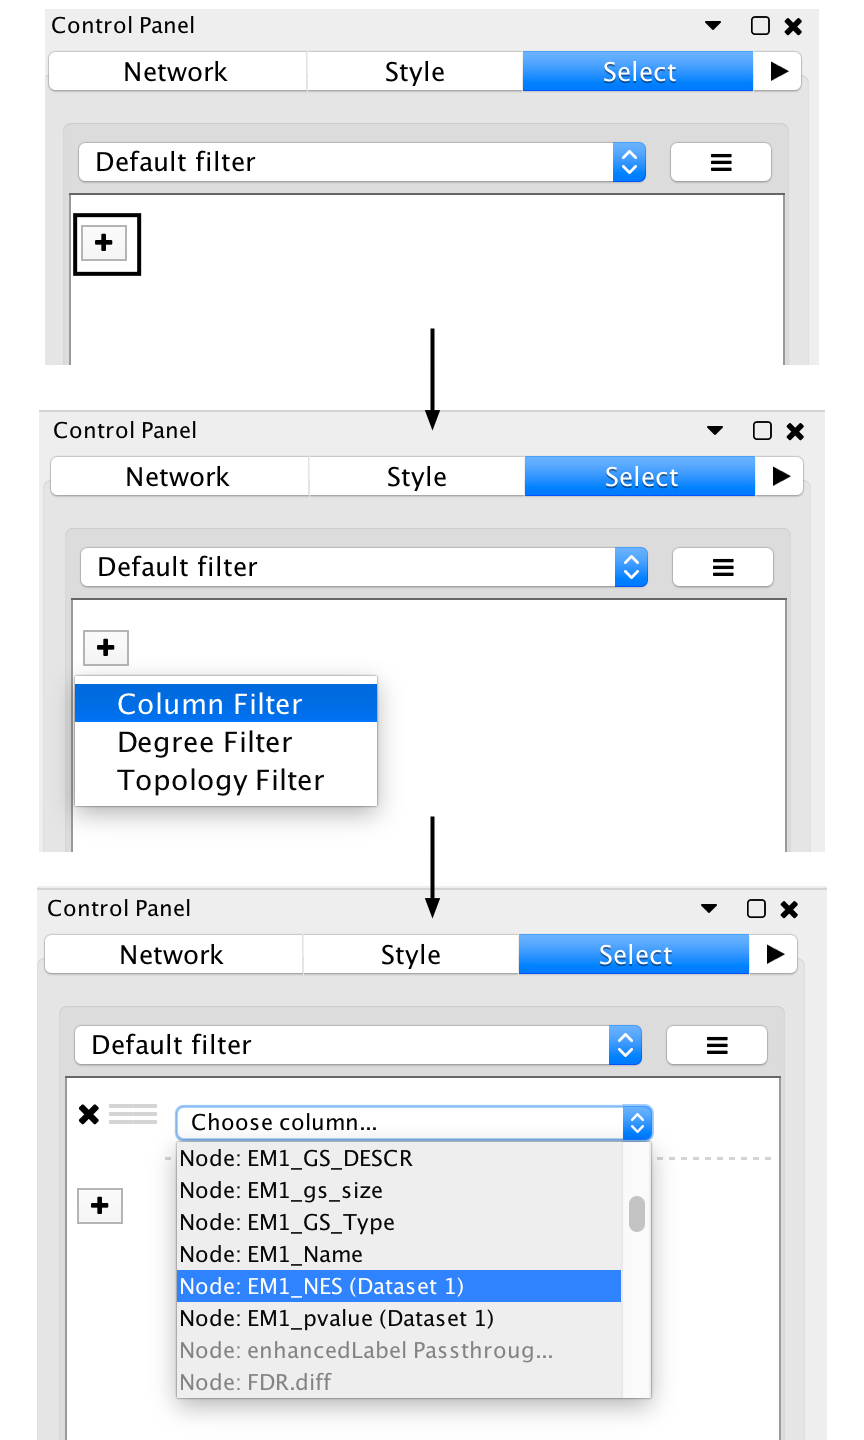
- Go to the Select tab in the Control Panel
- Click on the + symbol and select Column filter
- Click on Choose column… and select “EM1_NES (Mesem_vs_Immuno)”
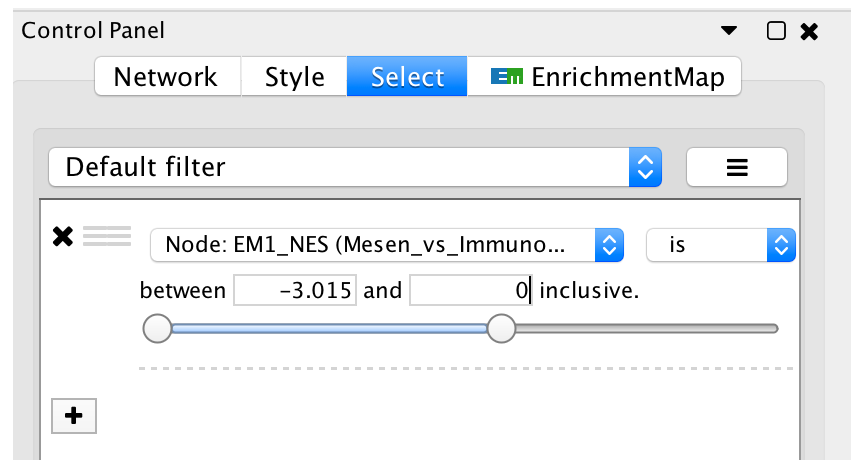
- Click on the box next to between and change the value to zero. Click Apply at the bottom of the panel.
- All red nodes should now be selected. Click and hold on any selected node and drag selection to the left until it does not overlap any blue nodes.
- Select Layouts from the Cytoscape menu and apply Prefuse Force Directed Layout --> Selected Nodes Only --> (none).
15. Organize and clarify the network - cont'd
- Go back to the Control Panel Select tab, adjust slider to select all negative values. Click on Apply at the bottom of the Select tab.
- All blue nodes should now be selected. Click and hold on any selected node and drag selection to the right until it does not overlap any red nodes.
- Select Layouts from the Cytoscape menu and apply Prefuse Force Directed Layout --> Selected Nodes Only --> (none).
Troubleshooting - Organizing Results
- TROUBLESHOOTING: Which is the best layout to use?
- There are many different layout algorithms available in Cytoscape that can be used for EnrichmentMap.
- We recommend using an edge weighted layout, which considers the overlap score between pathways.
- Most layouts (except yFiles) offer the ability to organize just the selected nodes.
- Experiment with different layouts to see which works best with your data. If you do not like the resulting layout, press command-Z on macOS or ctrl-Z on Windows or click on Edit --> Undo to revert to the previous view.
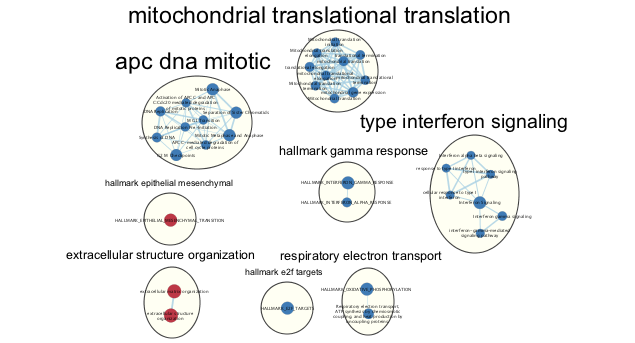
16. Define major biological themes.
Enrichment maps typically include clusters of similar pathways representing major biological themes. Clusters can be automatically defined and summarized using the AutoAnnotate Cytoscape app. AutoAnnotate first clusters the network using the clusterMaker2 app and then summarizes each cluster based on word frequency within the pathway names via the WordCloud app.
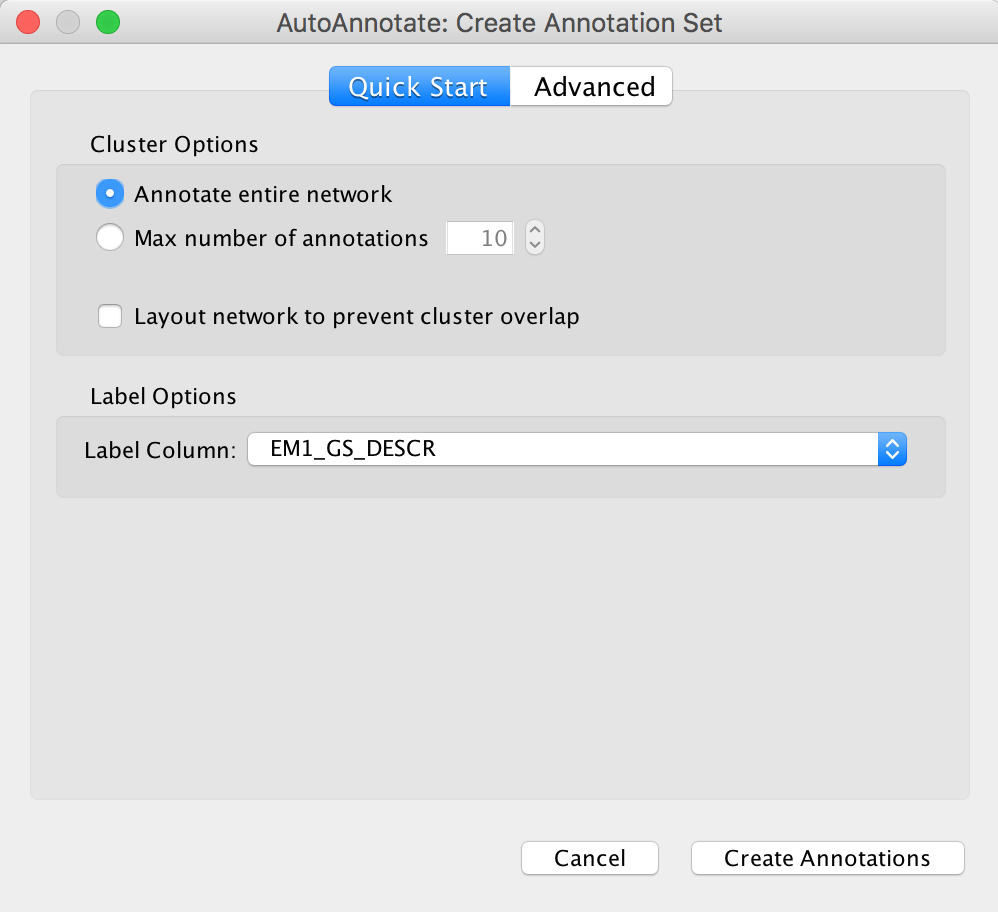
- From the Cytoscape menu bar, launch AutoAnnotate by selecting Apps, AutoAnnotate, New Annotation Set…
- The AutoAnnotate: Create Annotation Set panel will appear.
- In the Quick Start tab click on Create Annotations.
Troubleshooting - Defining major themes
- TROUBLESHOOTING: Labels contain uninformative words.
- Node names contain uninformative words that are not excluded by default or are not considered during network normalization.
- If particular non-informative words keep appearing in the labels generated by AutoAnnotate, try adjusting the WordCloud normalization factor.
- The significance of each word is calculated based on the number of occurrences in the given cluster of pathways.
- This causes frequent words such as “pathway” or “regulation” to be prominent. By increasing the normalization factor, we reduce the priority of such recurrent words in cluster labels. If that doesn’t help, you can add the non-informative words to the WordCloud word exclusion list.
16. Define major biological themes - cont'd
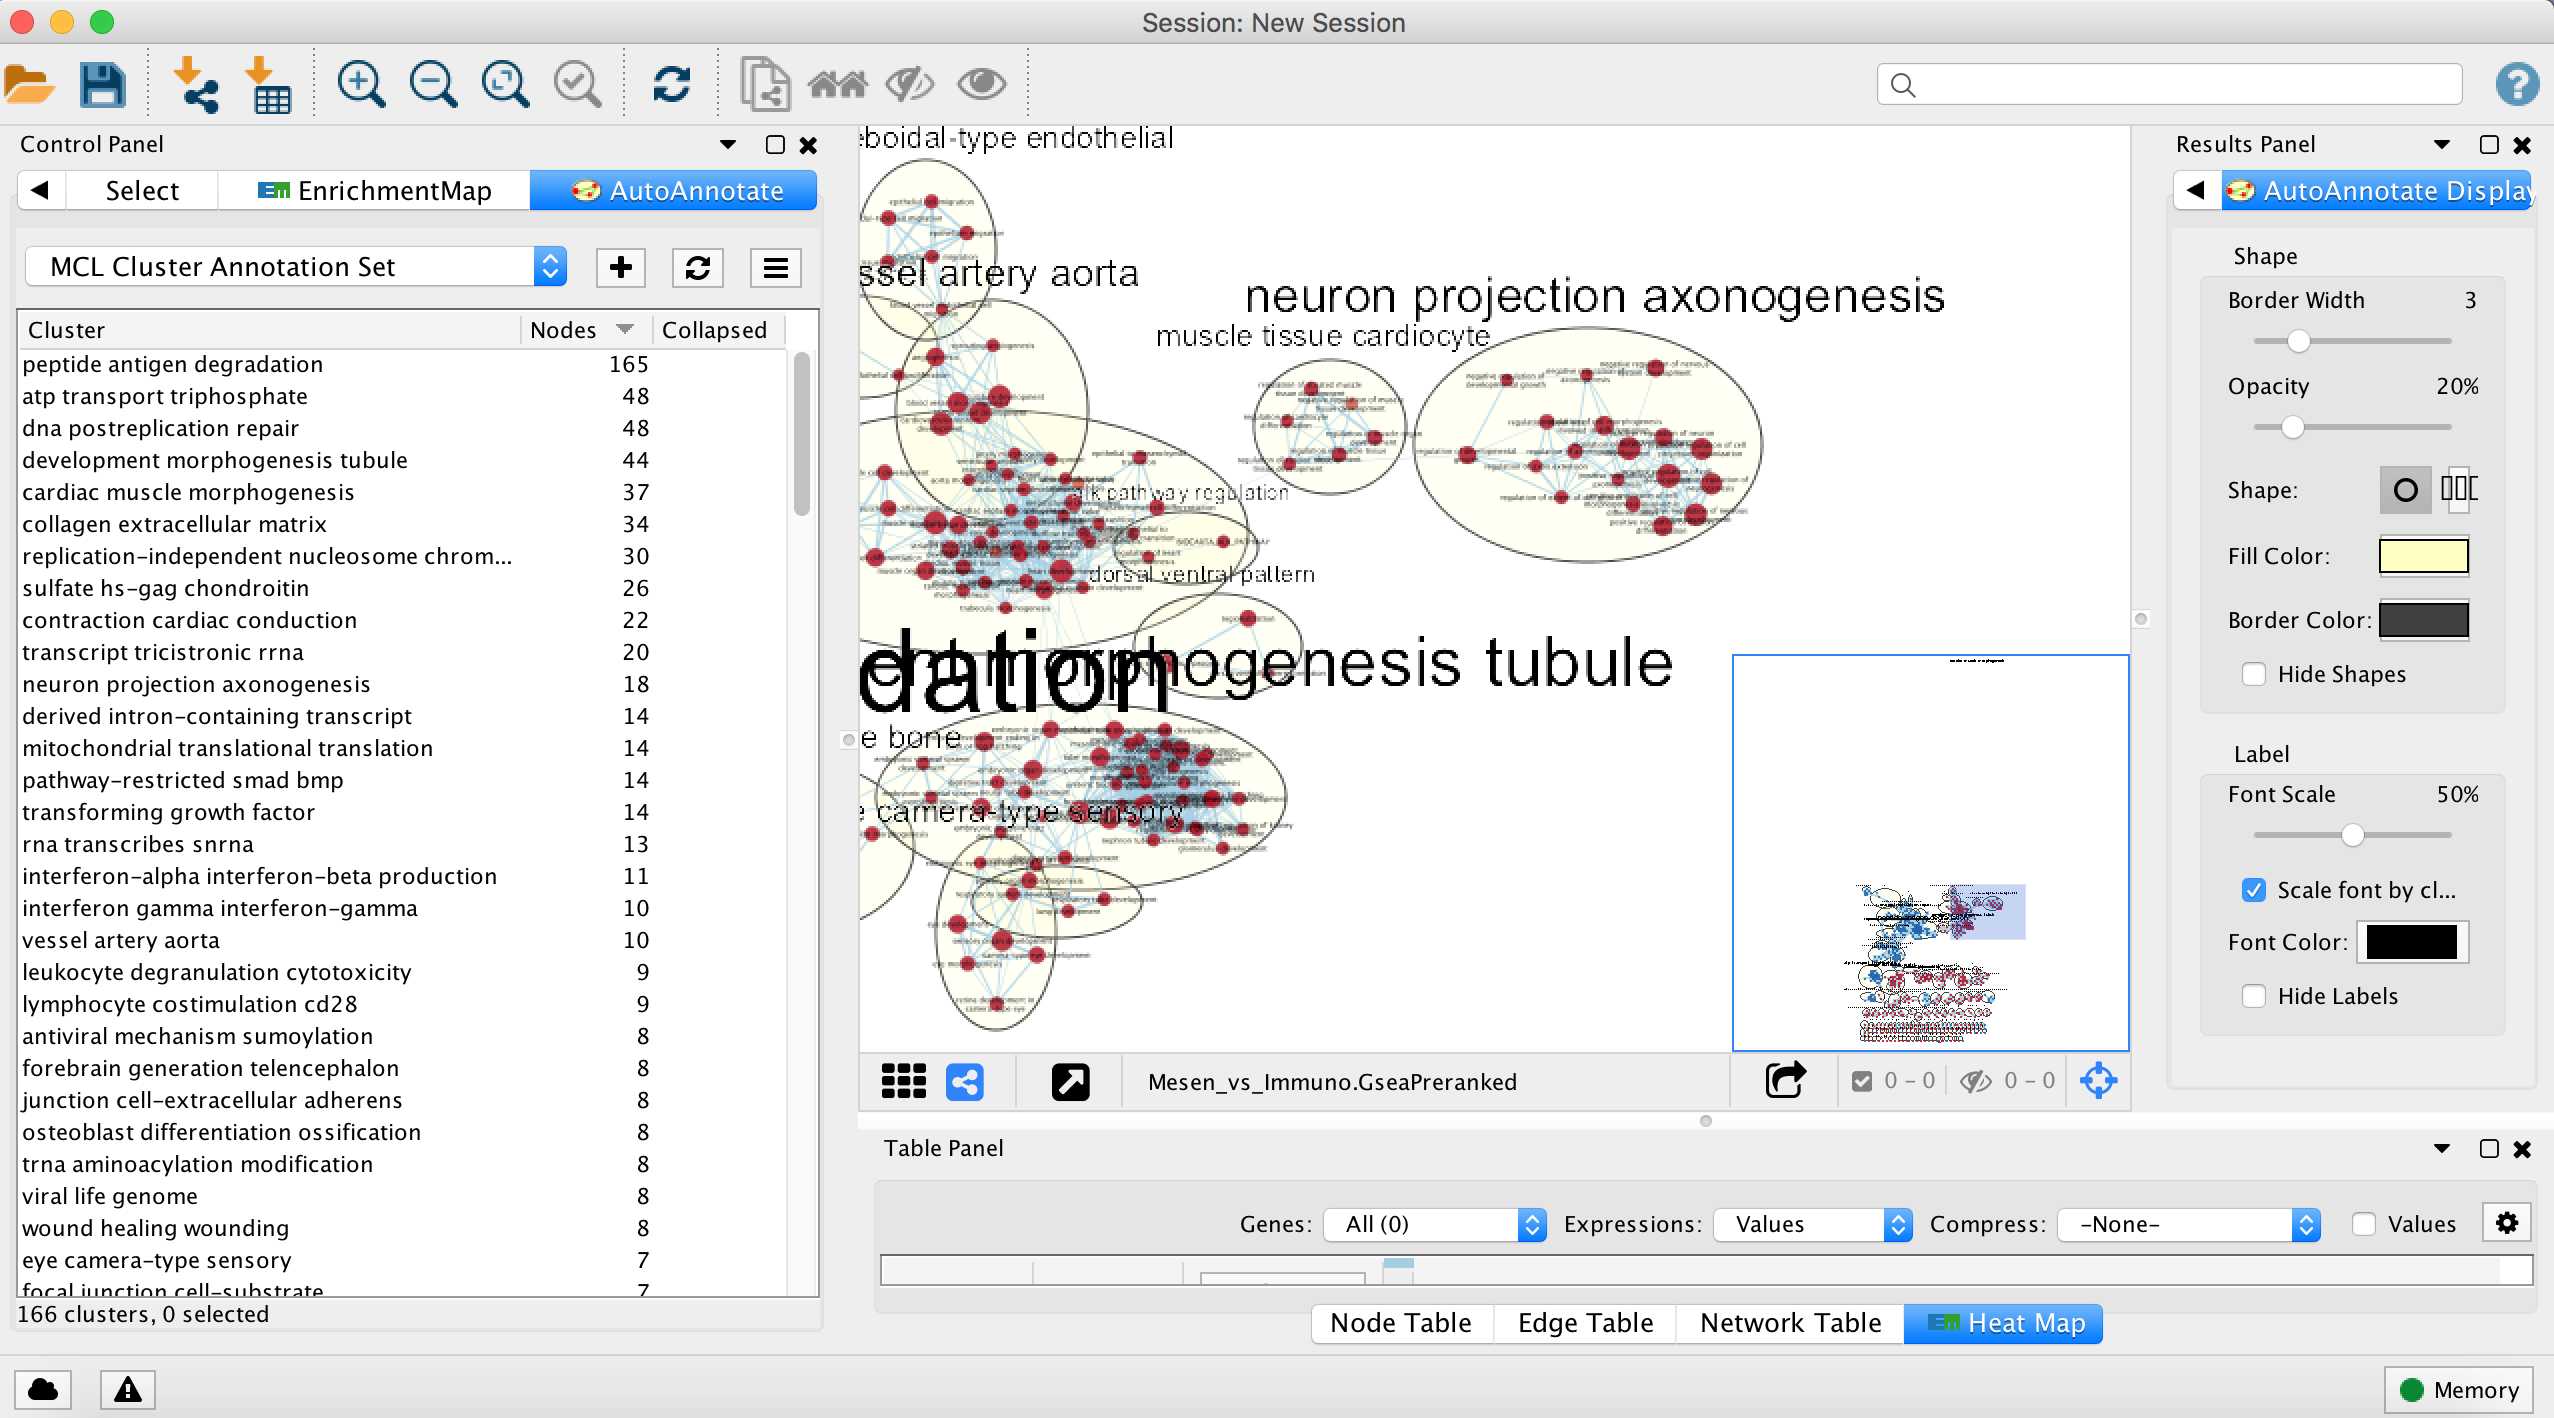
- Each cluster in the network will have a circle annotation drawn around it and will be associated with a set of words (by default three) that correspond to the most frequent node labels in the cluster.
- These words are automatically selected and often must be manually renamed (see Step 18iii).
- Moving individual nodes within a cluster will automatically resize the surrounding circle and moving an entire cluster will redraw the surrounding circle in the new cluster location.
Troubleshooting - Defining major themes
- TROUBLESHOOTING: Labels are bigger for bigger clusters but I want all the labels to be the same size.
- Setting to scale labels to the size of the cluster is enabled.
- The number of nodes in a cluster determines label size by default. Thus, the cluster size may relate to pathway popularity instead of importance in the experiment. Annotation labels can all be set to the same size by unchecking the option “Scale font by cluster size” in the AutoAnnotate results panel.
16. Define major biological themes - cont'd
- Manually arrange clusters to clean up the figure. Move nodes to reduce node and label overlap. Figure above shows the results of this process.
17. Create a simplified network view
This creates a single group node for every cluster with a summarized name and provides an overview of the enrichment result themes that is useful for enrichment maps containing many nodes.
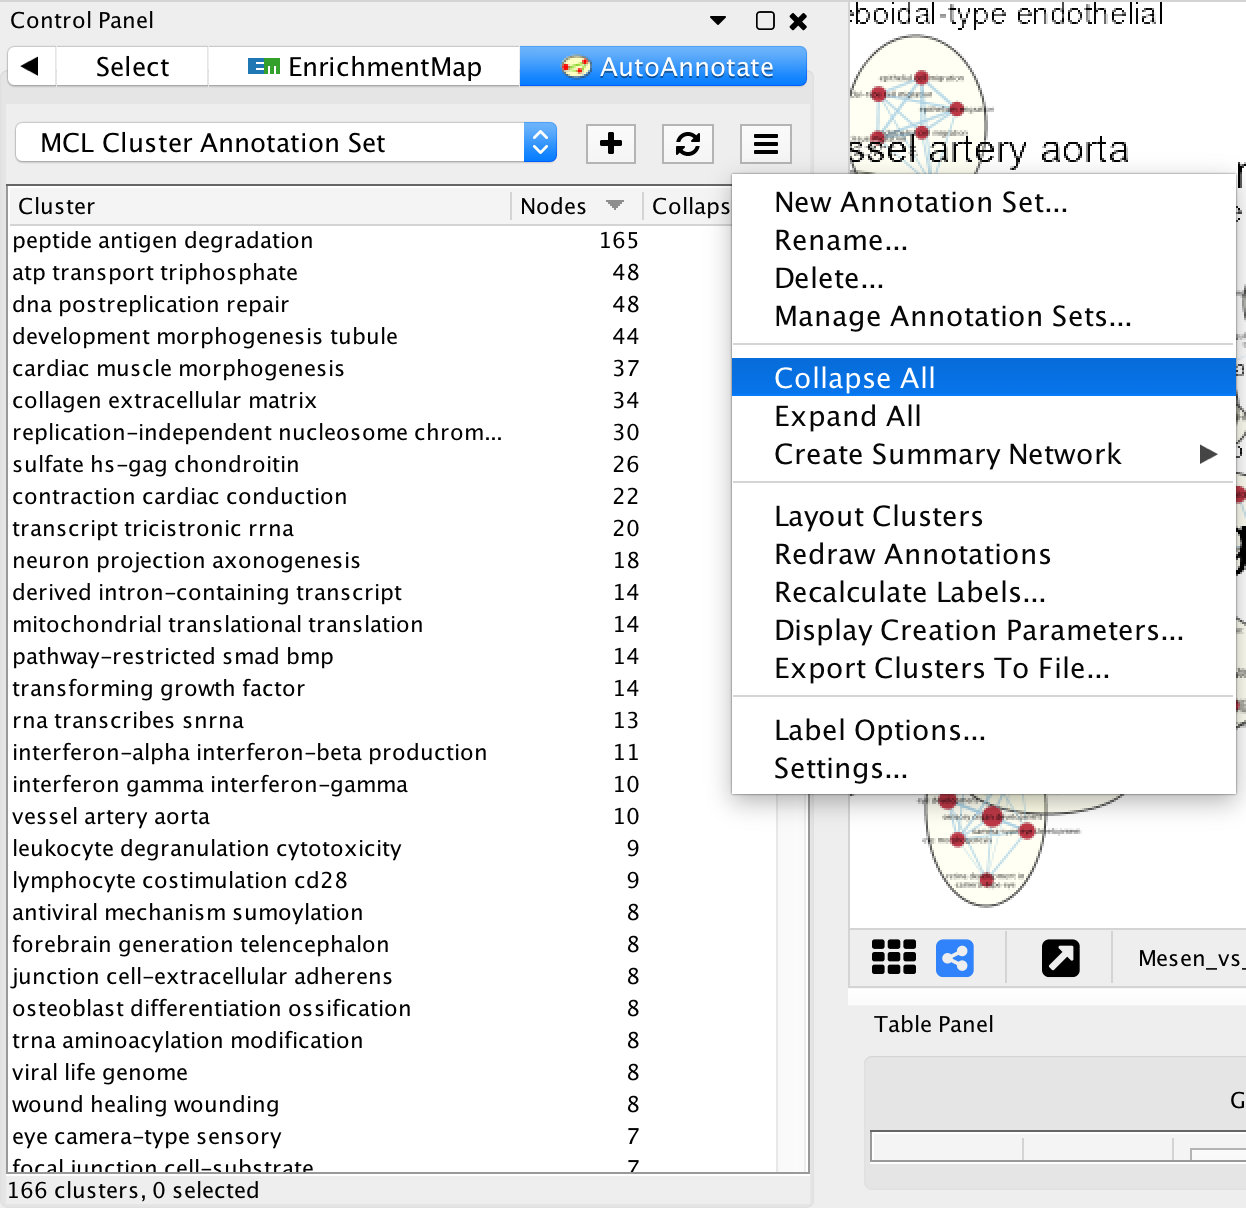
- In Control Panel select the AutoAnnotate tab.
- Click on the Menu icon in the upper right corner.
- Select Collapse All.
17. Create a simplified network view - cont'd
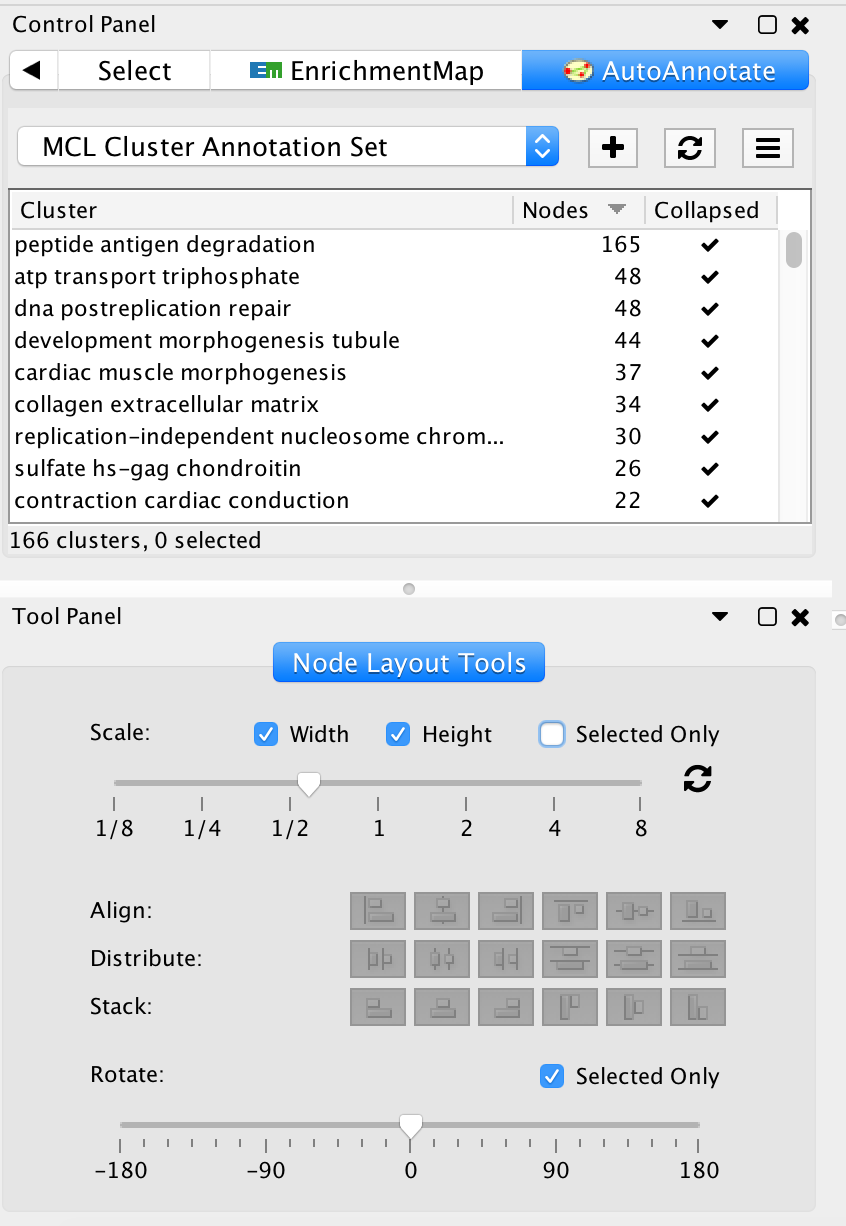
- In the Cytoscape menu bar, select View --> Show Tool Panel.
- Go to the Node Layout Tools panel located at the bottom of the Control Panel.
- Locate the Scale slider bar and use it on unselected nodes (uncheck Selected only).
- Move slider left to tighten the node spacing. Close the Node Layout Tools panel when finished.
Troubleshooting - Creating simplified network view
- TROUBLESHOOTING: Pop up after selecting "Collapse all" shows up everytime I collapse my clusters.
- Have not specified "Don't ask me again" option on pop up.
- Once you click on “Collapse All” a pop-up window will show the message “Before collapsing clusters please go to the menu Edit->Preferences->Group preferences and select “Enable attribute aggregation”. There is no need to adjust this parameter repeatedly. Click on “Don’t ask me again” and “OK” if you have set this parameter previously.
- TROUBLESHOOTING: Collapsing my network takes a long time.
- The larger the network or the more clusters in a network, the longer collapsing will take.
- For large networks, collapsing and expanding may take time. For a quick view of the collapsed network you can create a summary network by selecting the “Create summary Network…”. There are two options for the summary network: “clusters only” which creates a summary network with just the circled clusters, or “clusters and unclustered nodes” which creates a summary network that also includes the singleton nodes not part of any cluster.
- TROUBLESHOOTING: Collapsed network contain grey nodes instead of colored as they were in the pre-collapsed network.
- Attribute aggregation in not enabled.
- If the nodes in the resulting collapsed network are grey then you forgot to enable attribute aggregation. Expand clusters and before collapsing clusters again, go to the menu Edit->Preferences->Group preferences and select “Enable attribute aggregation".
18. Manually arranging the network
Manually arranging the network nodes and custom labeling the major themes is required for the clearest network view and for a publication quality figure. For instance, it is useful to bring together similar themes, such as signaling or metabolic pathways, even if they are not connected in the map. Use of space should be optimized so that large amounts of white space are not present. This is a time consuming step, but the more effort spent, the higher quality the resulting figure will be.
- If the focus of the figure is only on a subset of the network, it can be easier to work with just the subset.
- To create this, select the nodes of interest, then in the Cytoscape menu bar select File --> New --> Network --> From selected nodes --> all edges
- or alternatively use the corresponding icon in the Cytoscape tools menu bar (New network from selection, (all edges)).
18. Manually arranging the network - cont'd
- When the purpose of the figure is to show a large network and highlight only the main themes,
- clicking on Publication ready located at the bottom of the EM Control panel will remove node labels.
- To revert to the original network, click on the Publication ready button again.
- Automatic WordCloud-generated theme names are useful for quickly exploring an enrichment map, but frequently need to be renamed for publication quality figures.
- Naming should carefully consider all pathways and genes within each theme.
- Themes can be renamed in AutoAnnotate by right-clicking the name in the AutoAnnotate panel in the “Cluster” column, and selecting Rename…
- Alternatively, labels can be changed in external drawing software (see Step 20). Note that re-clustering the network will reset theme names.
Troubleshooting - Arranging Network
- TROUBLESHOOTING: In the EnrichmentMap input panel, the bottom options "Publication Ready" and "Set Signature Edge Width" are not visible.
- The Node Layout Tool is open.
- Close the Node Layout Tools window using the x symbol located at the top right corner.
19. Create a subnetwork
Create a subnetwork that highlights a specific theme subset. Enrichment maps of rich omics data sets are often large and complicated and it is often useful to emphasize specific themes or relevant pathways in a final figure. For example, we will select the top mesenchymal and immunoreactive pathways and create a subnetwork for detailed visualization.
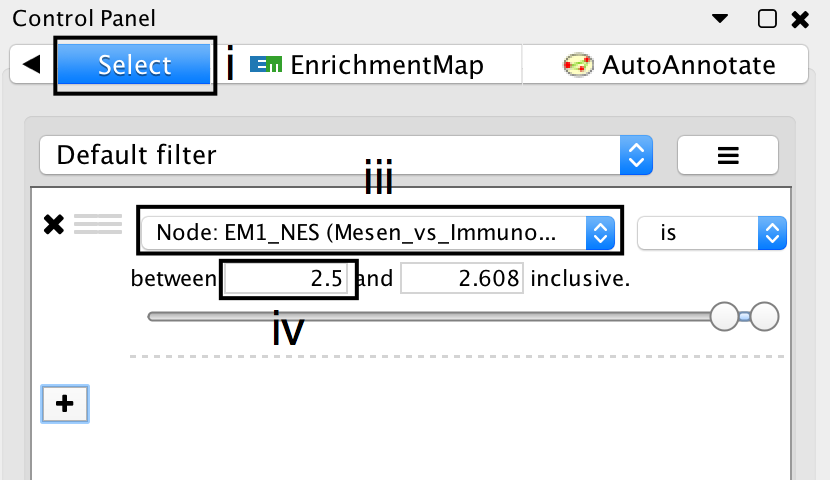
- Click on the Select tab in the Control Panel.
- Click on the + symbol and select Column filter.
- Click on Choose column… and select “EM1_NES (Mesem_vs_Immuno)”.
- Click on the box next to between and replace the negative value by 2.5. Do not change the positive value next to inclusive. Click Enter.
19. Create a subnetwork - cont'd
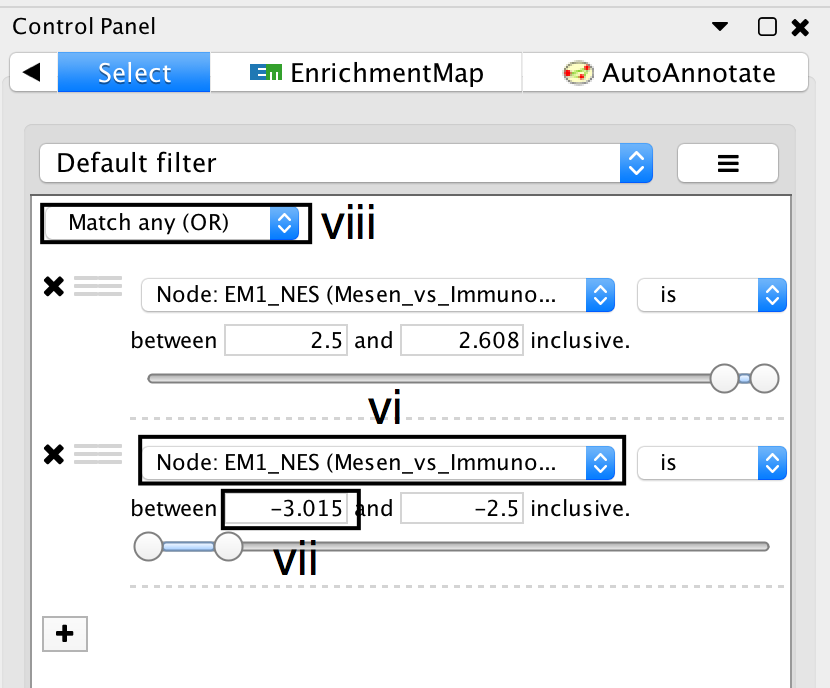
- Click on the + symbol and select Column filter.
- Click on Choose column… and select “EM1_NES (Mesem_vs_Immuno)”.
- Click on the box next to inclusive and change the value to -2.5. Do not change the negative value next to between. Click Enter.
- Above the two column filters you just added, change the drop down from Match all (AND) to Match any (OR).
- Click on Apply. Under the apply button, it should display the number of nodes and edges selected. In this example, 32 nodes should be selected.
19. Create a subnetwork - cont'd
- From the Cytoscape menu, Select File --> New --> Network --> From selected nodes, all edges.
- A new smaller network should appear. Manually move nodes around to optimize the layout.
- Annotate the network as described in Step 16
Troubleshooting - Create subnetwork
- TROUBLESHOOTING: The created subnetwork is empty.
- Nodes were not selected prior to the creation of the subnetwork.
- Make sure that the nodes that will be part of the subnetwork are selected before creation of the subnetwork.
20. Export an image
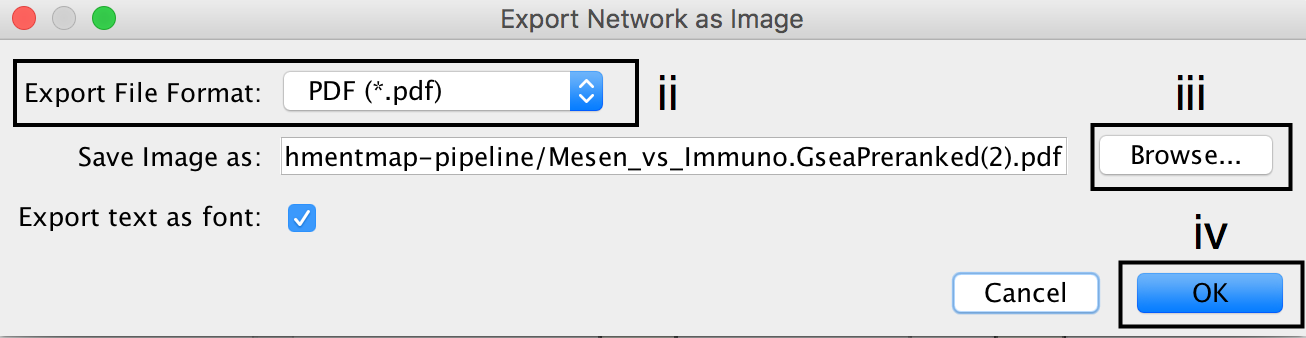
- In the Cytoscape menu bar, select File --> Export as Image…
- Set the Export File Format to PDF (*.pdf).
- Click on Browse… to specify file name and location.
- Click on Save to close the browser window and then on OK.
Troubleshooting - Export image
- TROUBLESHOOTING: Exported image only contains a small subset of my network.
- Only what is visible in the view is exported.
- In image export, only the visible part of the map will be exported. Make sure that the entire network is visible on your screen before exporting.
21. Identify network creation parameters
Identify network creation parameters. In the previous step we exported the network as an image, but the parameters used to create the map are needed to interpret and reproduce the image.
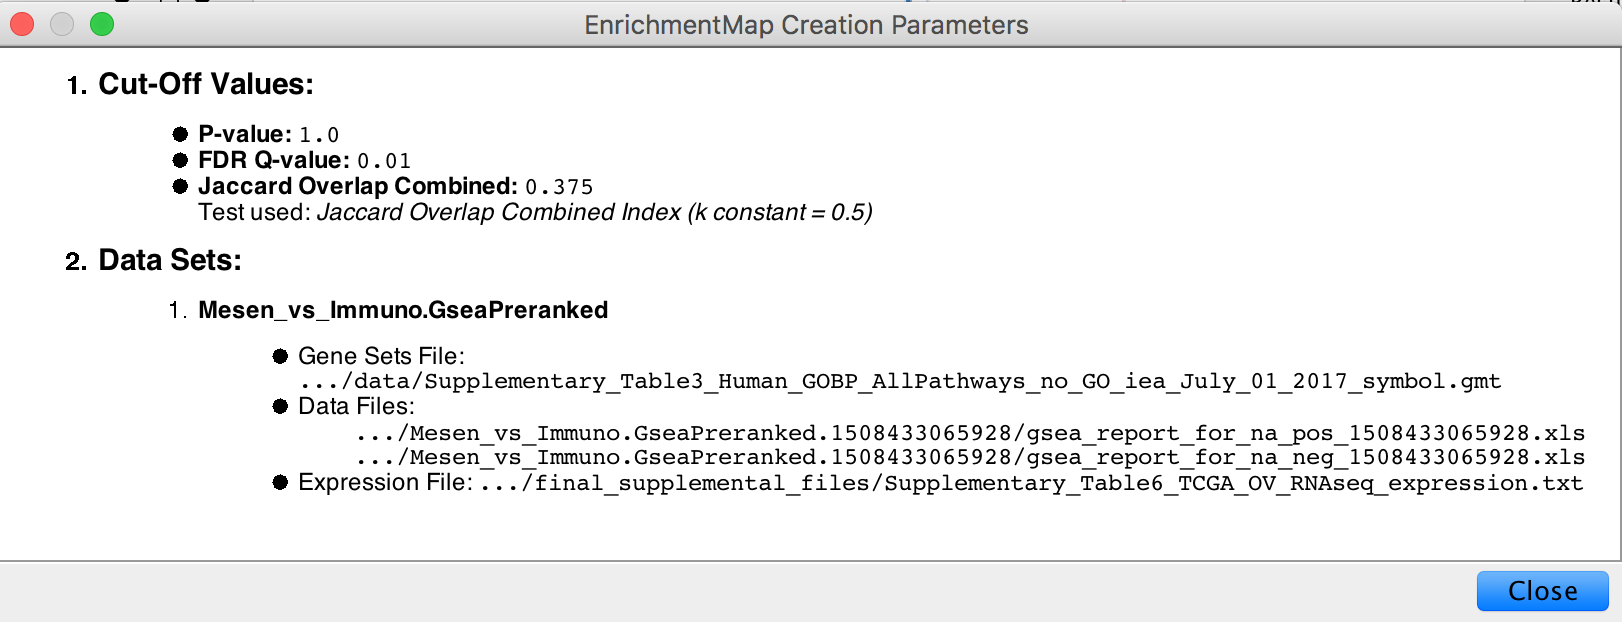
- In the Control Panel, locate the EnrichmentMap Input panel and click on the cog (settings) icon in the top right-hand corner.
- Click on show Creation Parameters…
- In the displayed panel you will find the FDR q-value, similarity metric and threshold parameters to be added to the text legend of figure. In this example: “Enrichment map was created with parameters q < 0.01, and Jaccard Overlap combined coefficient > 0.375 with combined constant = 0.5”.
Troubleshooting - Identify network creation parameters
- TROUBLESHOOTING: The parameters shown do not match what I expected them to be.
- The creation parameters panel only shows the parameters that were used at network creation. If you modified the network using filters or the EnrichmentMap slider bars you will have to update the thresholds accordingly.
22. Show and create a legend.
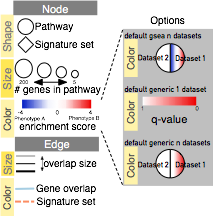
- In the Control Panel, locate the EnrichmentMap Input panel and click on the cog icon in the top right corner.
- Click on Show Legend.
- The example shows a simplified legend, however many different node and edge attributes like size, shape and color can be used in the enrichment map to represent different aspects of the data.
- It is important to describe them in the text associated with the figure or in the figure itself as a legend.
- The basic legend components (available as SVG and PDF images at http://baderlab.org/Software/EnrichmentMap#Legends) that can be used for an enrichment map figure. You can manually select the components relevant to your analysis.
23. Save all work as a Cytoscape session
- In the Cytoscape menu, select File --> Save As…
- Navigate to the directory you wish to save the session and specify the desired file name.
Acknowledgements
Presentation is based on the publication "Pathway enrichment analysis and visualization of omics data using g:Profiler, GSEA and Cytoscape EnrichmentMap"
Written by:
Jüri Reimand, Ruth Isserlin, Veronique Voisin, Mike Kucera, Christian Tannus-Lopes, Asha Rostamianfar, Lina Wadi, Mona Meyer, Jeff Wong, Changjiang Xu, Daniele Merico, Gary D. Bader